

Highlights
- Hitech Corporation stock hit the 20.00% upper circuit at ₹200.16 on Tuesday.
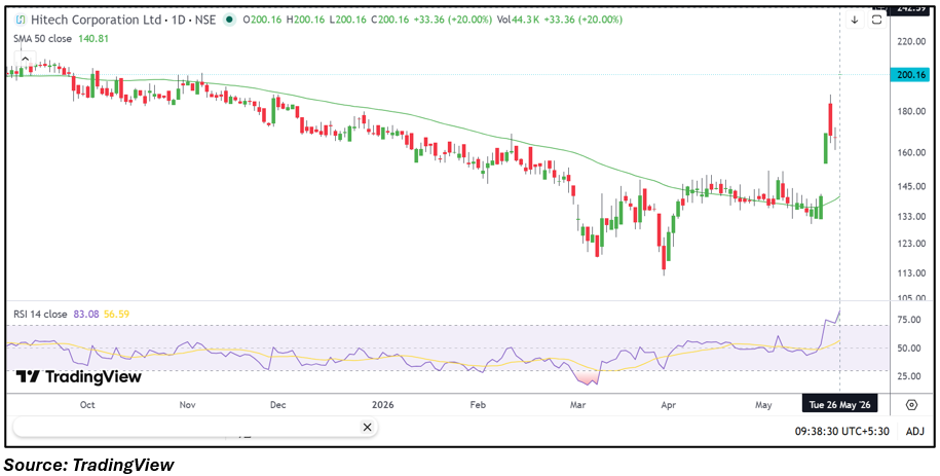
- The stock moved sharply above its 50-day SMA near ₹140.81 during the rally.
- RSI climbed near overbought territory, reflecting accelerated short-term momentum.
Overview
Hitech Corporation Limited (NSE: HITECHCORP) remained in focus after the stock surged 20.00% to ₹200.16 on May 26, 2026, locking in the upper circuit. The sharp move came alongside elevated momentum and strong price expansion, pushing the stock to fresh recent highs. The rally also placed the stock significantly above its 50-day simple moving average (SMA), reflecting a notable shift in near-term trend structure.
The company reported consolidated total income of ₹16,891.38 lakh for the quarter ended March 2026. Profit before tax stood at ₹1,023.98 lakh, while net profit came at ₹888.72 lakh. Earnings per share (EPS) was reported at ₹5.17.
Fundamental View
Hitech Corporation operates in the industrial packaging and rigid plastics segment. The latest quarterly numbers reflected profitability at both the operating and net levels. Investors appear to be tracking earnings visibility, margin trends, and demand conditions across industrial and consumer-linked packaging categories.
The latest price action suggests market participants are also evaluating the company’s earnings trajectory alongside broader momentum in select mid-cap industrial names.
Technical View
Hitech Corporation stock is trading near ₹200.16 while remaining sharply above its 50-day SMA near ₹140.81, indicating a significantly improved near-term structure. Recent price action reflects a strong breakout move after prolonged consolidation, with the stock witnessing aggressive upward expansion in a single session. The 14-day RSI moved near 83.08, entering overbought territory and indicating elevated momentum conditions. Immediate support is placed around ₹180.00–₹165.00, while resistance is seen near ₹220.00–₹239.00. Sustaining above the breakout zone could keep momentum active, although volatility may remain elevated after the sharp rally.
Key Technical Levels
The immediate support zone is placed near ₹180.00–₹165.00, which may act as a key cushion in case of short-term profit-booking. On the upside, resistance is placed around ₹220.00–₹239.00. A sustained move above this range could keep the broader upward momentum active in the near term.
Risks to Watch
- Sharp volatility after upper circuit movement.
- Overbought RSI conditions may trigger profit-booking.
- Weak broader market sentiment could impact momentum stocks.
- Failure to sustain above breakout zone may pressure sentiment.
Summary
Hitech Corporation shares witnessed a sharp upward move after the stock hit the 20.00% upper circuit at ₹200.16. The rally pushed the stock well above its 50-day SMA while RSI entered overbought territory, indicating elevated momentum conditions. Traders may closely monitor whether the stock sustains above breakout levels and whether momentum remains intact near the ₹220.00 resistance zone.
FAQs
Why did Hitech Corporation shares rise sharply today?
The stock surged after witnessing strong momentum buying and moved into the upper circuit zone at ₹200.16.
What does the RSI indicate for Hitech Corporation stock?
The RSI near 83.08 suggests overbought conditions and elevated short-term momentum in the stock.
What are the important levels to watch in Hitech Corporation shares?
Support is placed near ₹180.00–₹165.00, while resistance is seen around ₹220.00–₹239.00.