

Highlights
- Coffee Day Enterprises shares gained 12.88% amid renewed momentum and higher trading activity.
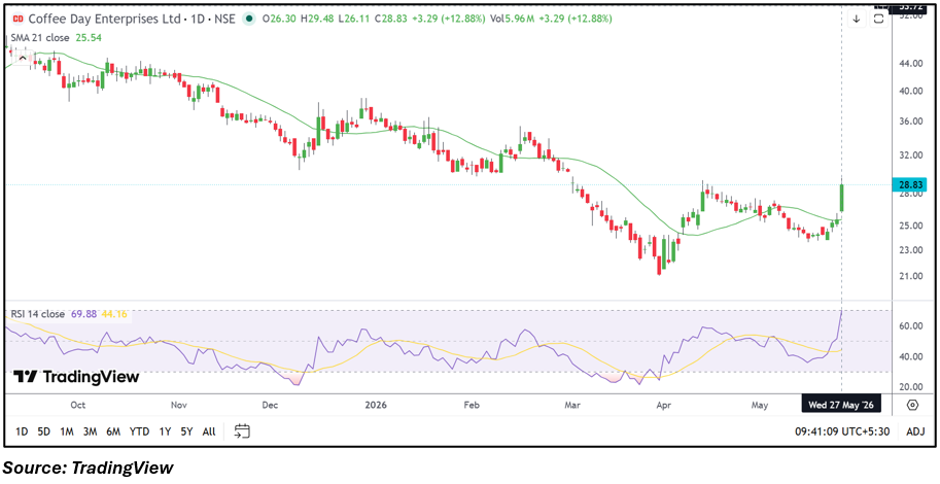
- The stock moved above its 21-day SMA near ₹25.54, improving the short-term structure.
- Traders are closely watching the ₹30.10–₹31.90 resistance zone after the recent breakout attempt.
Overview
Coffee Day Enterprises Limited (NSE: COFFEEDAY) remained among the actively watched stocks after rising 12.88% to ₹28.83 on May 27, 2026. The sharp move followed a period of range-bound consolidation, with the stock witnessing renewed momentum during the latest session.
The stock attracted trader attention after reclaiming levels above its short-term moving average while recording stronger price action compared to recent sessions.
Fundamental View
Coffee Day Enterprises reported standalone total income of ₹1,003.80 lakh for the quarter ended December 2025. The company posted profit before tax of ₹3,631.00 lakh, while net profit also stood at ₹3,631.00 lakh. Earnings per share for the reported quarter came in at ₹1.72.
Market participants continue monitoring the company’s operational and balance-sheet developments, as sentiment around the stock remains sensitive to earnings visibility and broader recovery expectations.
Technical View
Coffee Day Enterprises stock closed near ₹28.83 after witnessing a strong upside move during the session. The stock is now trading above its 21-day SMA near ₹25.54, reflecting improvement in the near-term price structure.
Recent price action indicates a breakout attempt after prolonged consolidation around lower levels. The 14-day RSI moved near 69.88, approaching the overbought zone and reflecting improving momentum conditions.
Immediate support is placed around ₹26.40–₹25.20, while resistance is seen near ₹30.10–₹31.90. Sustained movement above the resistance band could keep traders focused on continuation momentum in the near term.
Key Technical Levels
Coffee Day Enterprises is currently holding above its short-term support region near ₹26.40–₹25.20 after the latest rally. The stock has also moved above its moving average zone, improving the overall near-term setup. On the upside, the ₹30.10–₹31.90 range remains an important resistance area that traders may closely monitor during the coming sessions.
Risks to Watch
- Volatility may remain elevated after the sharp one-day rally.
- Resistance near ₹30.10–₹31.90 could limit near-term upside momentum.
- Weak broader market sentiment may impact smaller-cap stocks sharply.
- Sustaining profitability trends remains important for long-term sentiment.
Summary
Coffee Day Enterprises shares witnessed a strong rebound after a prolonged consolidation phase, with the stock moving above key short-term averages. Momentum indicators have improved, while traders are now monitoring whether the rally can sustain near the ₹30.10–₹31.90 resistance zone. The stock’s ability to hold above immediate support levels may remain important for near-term direction.
FAQs
Why did Coffee Day Enterprises shares rise today?
The stock gained after witnessing renewed momentum and a breakout attempt above recent consolidation levels.
What are the key support levels for Coffee Day Enterprises stock?
Immediate support is placed around the ₹26.40–₹25.20 zone based on recent price action.
Which resistance levels are traders watching in COFFEEDAY shares?
Traders are closely monitoring the ₹30.10–₹31.90 resistance region for further directional cues.