

Highlights
- Jet Freight Logistics shares gained nearly 10% amid improving short-term price momentum.
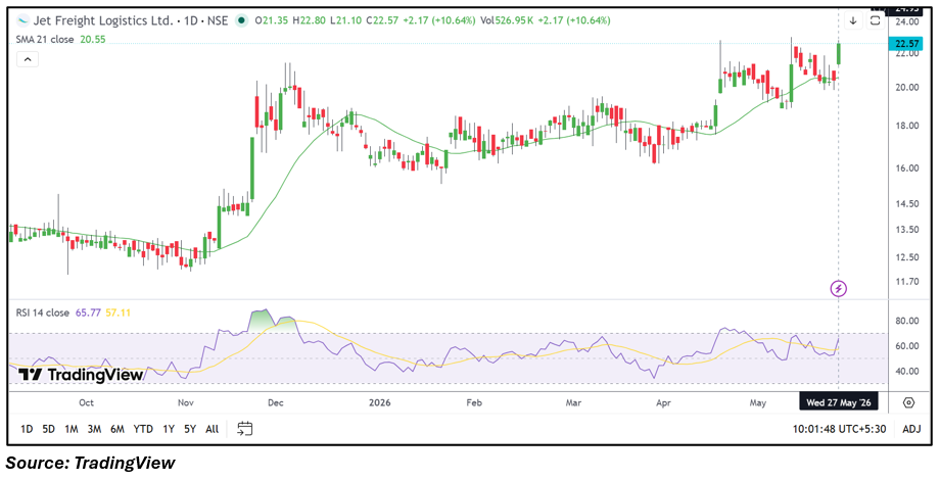
- The stock moved above its 21-day SMA after witnessing range-bound consolidation.
- Traders are closely watching resistance levels near INR 23.40–24.90 zone.
Overview
Jet Freight Logistics (NSE: JETFREIGHT) shares remained in focus on Wednesday after the stock surged close to 10% during the session. The rally pushed the stock near recent swing highs, while momentum indicators reflected improving sentiment after a prolonged consolidation phase.
The company reported consolidated total income of INR 12,868.43 lakh for the quarter ended March 2026. Profit before tax stood at INR 558.56 lakh, while net profit came in at INR 307.88 lakh. Earnings per share for the quarter was reported at INR 0.66.
Fundamental View
Market participants appeared to react positively to the company’s latest operational performance and improving profitability trend. Logistics and freight-linked counters have also witnessed selective activity in recent sessions amid expectations of steady cargo movement and improving supply chain demand.
The latest move has brought Jet Freight Logistics back into traders’ watchlists after a relatively subdued phase earlier this year.
Technical View
Jet Freight Logistics stock traded near INR 22.43 while remaining above its 21-day SMA near INR 20.55, reflecting improving near-term structure. Recent price action indicates the stock may be attempting a fresh upward phase after consolidating in a narrow range over the past few weeks.
The 14-day RSI moved near 65.77, indicating strengthening momentum conditions without entering deeply overbought territory. Sustained trading above current levels could keep momentum intact in the near term.
Momentum Indicator
Momentum conditions improved sharply following the recent breakout move. The RSI trend and expanding price range suggest increasing trader participation, though volatility may remain elevated around resistance zones.
Key Technical Levels
Jet Freight Logistics stock is currently witnessing immediate support near INR 21.00–19.50. A sustained hold above this range may support short-term stability. On the upside, resistance is placed near INR 23.40–24.90, which traders may monitor during the next few sessions.
Risks to Watch
- Sharp volatility may emerge after the recent rapid price movement.
- Weak freight demand could impact sentiment in logistics counters.
- Lower trading liquidity may increase short-term price fluctuations.
- Broader market weakness can affect momentum sustainability.
Summary
Jet Freight Logistics shares witnessed a strong upward move after consolidating for several weeks near lower levels. The stock has now moved above its short-term moving average, while momentum indicators have also strengthened. Traders are closely tracking whether the stock can sustain above breakout levels and extend gains toward the next resistance zone in the near term.
FAQs
Why did Jet Freight Logistics shares rise today?
The stock gained amid improving momentum and renewed trader activity after recent consolidation.
What are the key support levels for JETFREIGHT stock?
Immediate support for the stock is placed near INR 21.00–19.50 levels.
Which resistance levels are important for Jet Freight Logistics?
Traders are closely watching the INR 23.40–24.90 resistance zone.