

Highlights
- Modern Threads (NSE: MODTHREAD) is witnessing profit booking after a sharp recent rise.
- June 2026 standalone total income stood at ₹92.19 crore, with net profit of ₹5.73 crore.
- The stock opened at ₹57.47 and declined to an intraday low of ₹52.00.
- Price remains above the 50-day SMA of ₹47.37 despite the latest decline.
- Trading volume stood at 14.89K shares, with VWAP at ₹53.39.
- Investors should monitor momentum, volume behaviour, textile demand, margins and the ability to hold key technical levels.
Overview
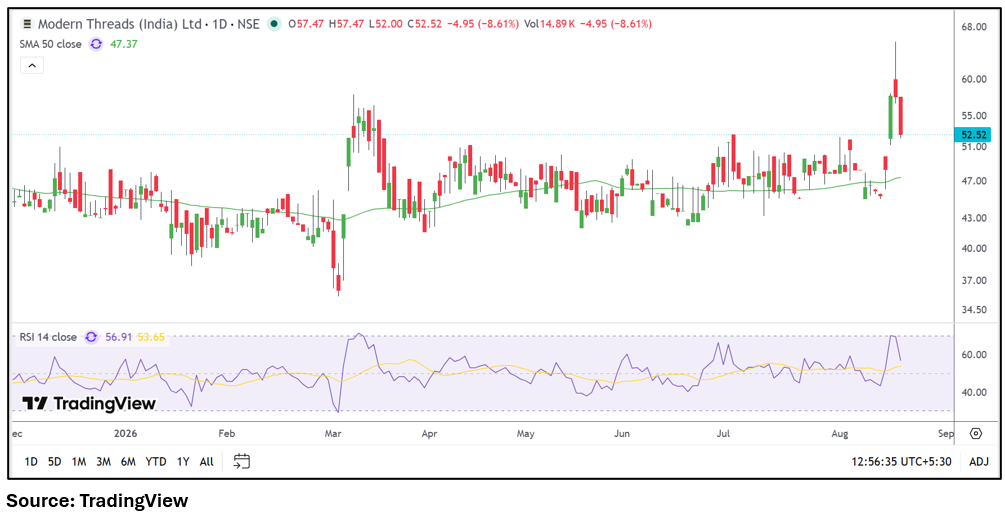
Modern Threads (India) Limited (NSE: MODTHREAD) operates in the textile and related manufacturing business. On August 19, 2026, the stock opened at ₹57.47, touched a high of ₹57.47 and declined to an intraday low of ₹52.00, with the market price around ₹52.52. VWAP stood at ₹53.39, while trading volume was 14.89K shares. The latest session follows a sharp upward move visible on the daily chart, during which the stock moved significantly above its earlier trading range. The subsequent decline indicates increased short-term volatility as the market assesses the recent move. Despite the pullback, the stock remains above its 50-day SMA, keeping the broader recent price structure in focus.
Fundamental View
For the quarter ended June 30, 2026, Modern Threads reported standalone total income of ₹92.19 crore, while profit before tax stood at ₹7.87 crore. Net profit was ₹5.73 crore and earnings per share stood at ₹1.65. The quarterly figures indicate positive profitability during the period, although the company's future performance will remain dependent on textile demand, product realizations, raw material costs, operating expenses and capacity utilization. Investors will also monitor margins and the consistency of earnings in subsequent quarters. Changes in cotton and other input costs, domestic demand and broader textile-sector conditions can influence the company's financial performance.
Technical View
The daily chart shows a volatile price structure, with the stock recently moving sharply higher before experiencing a pullback in the latest session. The 50-day SMA is positioned at ₹47.37, and the market price remains above this average despite the decline. RSI 14 stands at 56.91, having fallen from a much higher level following the recent surge, indicating that momentum has moderated but remains above the midpoint. The latest candle reflects rejection from the higher intraday level, while the reduction from the recent peak highlights increased volatility. Trading volume of 14.89K shares should be monitored alongside price movements to assess whether the current consolidation continues.
Key Technical Levels
Immediate support is visible around ₹52.00, corresponding with the day's low, followed by the ₹50.00 region. The next important support zone is around ₹47.37 near the 50-day SMA. Immediate resistance is around ₹57.47, matching the session's opening and high, while the next resistance area can be monitored near ₹60.00-₹62.00 based on the recent price structure. Movement around these levels can provide further indication of whether the stock remains in consolidation or resumes its recent directional move.
Risks to Watch
- The stock has displayed high short-term volatility following its recent sharp rise.
- A sustained decline toward the 50-day SMA could alter the recent price structure.
- Lower trading activity may make price movements more sensitive to individual transactions.
- Textile margins remain exposed to changes in cotton and other raw material costs.
- Future quarterly results will be important for assessing whether recent profitability is sustainable.
Summary
Modern Threads is experiencing a pullback after a sharp recent advance, with the stock currently positioned above its 50-day SMA of ₹47.37. The latest session saw the price move from an open and high of ₹57.47 to a low of ₹52.00, while RSI at 56.91 indicates that momentum has moderated from its recent elevated levels. Fundamentally, the June 2026 quarter recorded total income of ₹92.19 crore and net profit of ₹5.73 crore, with EPS at ₹1.65. Going forward, investors will monitor earnings consistency, textile-sector demand, input costs, margins, trading volumes and the stock's ability to maintain its position above important technical levels.
FAQs
Q: What business does Modern Threads (India) Limited operate in?
A: Modern Threads (India) Limited operates in the textile and related manufacturing business.
Q: What was Modern Threads' total income in June 2026?
A: The company reported standalone total income of ₹92.19 crore for the quarter ended June 30, 2026.
Q: What was Modern Threads' net profit in June 2026?
A: Modern Threads reported a net profit of ₹5.73 crore for the June 2026 quarter.
Q: What is the 50-day SMA of MODTHREAD?
A: The 50-day SMA shown on the daily chart is ₹47.37.
Q: What is the RSI of Modern Threads?
A: The 14-day RSI is 56.91, indicating moderated but still positive momentum relative to the midpoint.