

Highlights
- Rhetan TMT shares declined 19.07% to ₹21.18 on August 13, 2026.
- Q1 FY27 total income stood at ₹851.50 crore, with net profit at ₹315.83 crore.
- The stock opened at ₹29.00 and touched an intraday low of ₹21.00.
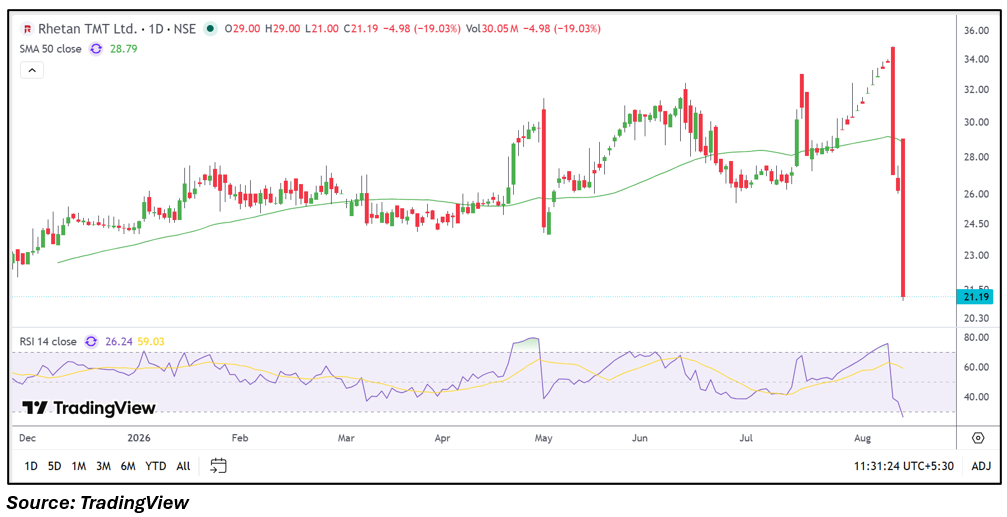
- The share price is below its 50-day SMA of ₹28.79.
- Trading volume reached 30.05 million shares during the session.
- Investors will monitor earnings quality, price stability, volumes and the stock’s ability to hold recent support levels.
Overview
Rhetan TMT Limited (NSE: RHETAN) is engaged in the manufacturing and marketing of steel products, with its operations linked to the broader infrastructure and construction ecosystem. The stock came under sharp pressure on August 13, 2026, declining 19.07% to ₹21.18 from the previous close of ₹26.17. It opened at ₹29.00, also marked the session high of ₹29.00, and fell to a low of ₹21.00, while the VWAP stood at ₹22.18. The sharp price movement followed the company’s latest June 2026 quarter financial disclosure and came with elevated trading activity. The session showed a significant change in the stock’s short-term price structure.
Fundamental View
For the quarter ended June 30, 2026, Rhetan TMT reported standalone total income of ₹851.50 crore. Profit before tax stood at ₹330.73 crore, while net profit was ₹315.83 crore. Earnings per share were reported at ₹0.04. Based on the reported figures, profit before tax represented around 38.85% of total income, while net profit represented around 37.10%. The company’s financial performance will need to be assessed alongside revenue composition, operating costs, steel prices, demand conditions and cash-flow generation. Investors may also monitor whether profitability remains consistent across subsequent quarters and how changes in the steel and infrastructure markets affect future performance.
Technical View
The technical structure weakened sharply during the latest session. The stock closed around ₹21.18, below its 50-day SMA of ₹28.79, after opening at ₹29.00 and falling to ₹21.00. The RSI 14 reading stood at 26.24, moving into the lower portion of the indicator range following the sharp decline. Trading volume was approximately 30.05 million shares, highlighting substantial activity during the fall. The latest candle also represents a pronounced breakdown from the recent trading area around ₹26.00-₹29.00. Momentum has therefore changed significantly, while further price action and volume behaviour will be important for assessing the next technical structure.
Key Technical Levels
Immediate support is around ₹21.00, corresponding to the latest session low. Next support is near ₹20.30, based on the lower visible chart zone. Immediate resistance is around ₹26.17, which corresponds to the previous close. Next resistance is near ₹28.79, close to the 50-day SMA and the recent upper trading area.
Risks to Watch
- The stock remains below its 50-day SMA following the sharp decline.
- Elevated trading volume could contribute to continued short-term volatility.
- A sustained move below recent lows could alter the broader price structure.
- Steel prices and demand conditions can influence operating performance.
- Future quarterly results will be important for assessing earnings consistency.
Summary
Rhetan TMT reported June 2026 quarter total income of ₹851.50 crore, profit before tax of ₹330.73 crore and net profit of ₹315.83 crore, while its stock declined 19.07% to ₹21.18 on August 13. The technical structure weakened as the price moved below its 50-day SMA of ₹28.79, with RSI at 26.24 and volume rising to around 30.05 million shares. Going forward, investors will monitor subsequent financial results, steel-sector conditions, profitability, trading volumes and the stock’s response around the ₹21.00 and ₹28.79 technical reference levels.
FAQs
Q: Why did Rhetan TMT stock fall on August 13, 2026?
A: The stock declined 19.07% during the session as investors assessed the latest financial disclosure alongside the sharp change in its technical structure.
Q: What was Rhetan TMT’s Q1 FY27 net profit?
A: Rhetan TMT reported a standalone net profit of ₹315.83 crore for the quarter ended June 30, 2026.
Q: What was Rhetan TMT’s Q1 FY27 total income?
A: Total income was reported at ₹851.50 crore for the June 2026 quarter.
Q: What is Rhetan TMT’s 50-day SMA?
A: The 50-day SMA shown on the chart is ₹28.79, above the latest price of ₹21.18.
Q: What should investors monitor?
A: Investors should monitor upcoming earnings, steel-sector conditions, profitability, trading volumes and the stock’s ability to establish stability around recent technical levels.