

Highlights
- Shanthi Gears Limited (NSE: SHANTIGEAR) advanced 16.70% during the latest trading session.
- June 2026 total income stood at ₹11,965.00 lakh, while net profit was ₹985.00 lakh.
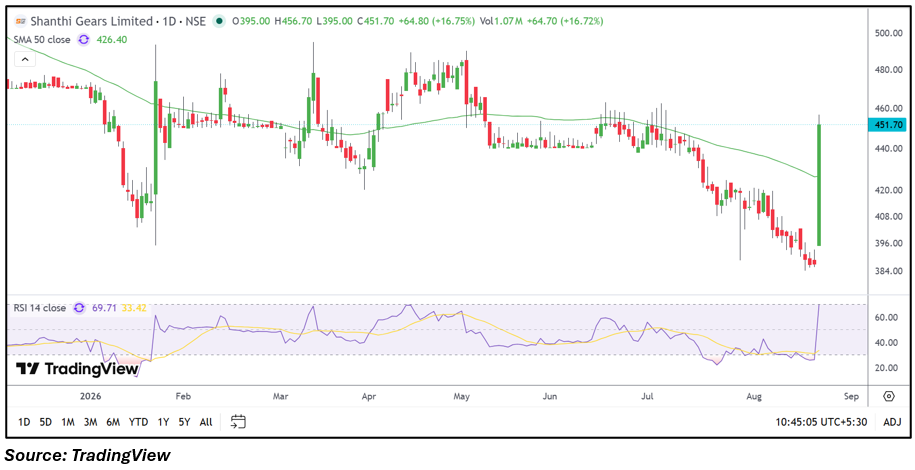
- The stock opened at ₹395.00 and reached a high of ₹456.70, with the day's low at ₹395.00.
- The price moved above the 50-day SMA of ₹426.40, while RSI 14 stood at 69.71.
- Trading volume reached approximately 1.07 million shares, with VWAP at ₹442.89.
- Investors should monitor the latest price structure, RSI, volumes and upcoming financial performance.
Overview
Shanthi Gears Limited (NSE: SHANTIGEAR) operates in the industrial gearing and power transmission solutions segment, supplying engineered gear systems and related products for industrial applications. On 21 August 2026, the stock opened at ₹395.00 and reached a high of ₹456.70, while the session low was ₹395.00. The current price stood at ₹451.50, compared with the previous close of ₹386.90, while VWAP was ₹442.89. The latest movement represents a sharp recovery from the lower levels visible in the recent chart structure. The stock has also moved above its 50-day SMA, while elevated trading volume indicates increased market activity during the session.
Fundamental View
For the quarter ended 30 June 2026, Shanthi Gears Limited reported standalone total income of ₹11,965.00 lakh, profit before tax of ₹1,417.00 lakh and net profit of ₹985.00 lakh. Earnings per share stood at ₹1.28. Profit before tax represented approximately 11.84% of total income, while net profit represented about 8.23%. The latest results indicate continued profitability, with future financial performance dependent on revenue growth, industrial demand, order activity, operating margins and cost management. Subsequent quarterly results will be important for assessing whether the reported earnings performance remains consistent.
Technical View
The daily chart shows a substantial recovery from the recent lower levels around ₹385.00-₹390.00. The current price of ₹451.50 is above the 50-day SMA of ₹426.40, marking a notable improvement in the recent price structure. RSI 14 stands at 69.71, approaching the conventional 70 level after the sharp upward movement. Trading volume of approximately 1.07 million shares is also elevated compared with the recent activity visible on the chart. The latest session reached ₹456.70, leaving the stock close to its intraday high and highlighting strong short-term momentum.
Key Technical Levels
The ₹426.40 area, corresponding to the 50-day SMA, is a key visible chart reference, while ₹395.00 marks the latest session opening and low. On the upside, ₹456.70 is the latest visible high, followed by the ₹460.00-₹465.00 region as a nearby chart zone. These levels can be monitored alongside volume and RSI to assess whether the current price structure continues to strengthen or moves into consolidation.
Risks to Watch
- RSI at 69.71 indicates elevated short-term momentum.
- A sustained move below the 50-day SMA could weaken the recent recovery structure.
- Sharp price movements can result in higher short-term volatility.
- Changes in industrial demand and input costs could affect margins.
- Future quarterly earnings remain important for assessing financial consistency.
Summary
Shanthi Gears Limited (NSE: SHANTIGEAR) has recorded a notable technical recovery, with the stock trading at ₹451.50 after rising 16.70% during the latest session. The June 2026 quarter reported total income of ₹11,965.00 lakh and net profit of ₹985.00 lakh, while EPS stood at ₹1.28. Technically, the stock is above its 50-day SMA of ₹426.40, with RSI at 69.71 and trading volume around 1.07 million shares. The ₹426.40, ₹395.00 and ₹456.70 levels remain important visible chart references. Future earnings, operating margins, industrial demand, trading activity and price behaviour around these levels will remain relevant to monitor.
FAQs
Q: What is Shanthi Gears Limited's latest share price?
A: Shanthi Gears Limited (NSE: SHANTIGEAR) was trading at ₹451.50 on 21 August 2026 based on the provided market data.
Q: What was Shanthi Gears' net profit in June 2026?
A: Shanthi Gears Limited reported a net profit of ₹985.00 lakh for the quarter ended 30 June 2026.
Q: What is Shanthi Gears' 50-day SMA?
A: The 50-day SMA shown on the daily chart is ₹426.40.
Q: What is the current RSI of Shanthi Gears?
A: The RSI 14 reading shown on the chart is 69.71.
Q: What should investors monitor in Shanthi Gears?
A: Investors can monitor price behaviour around ₹426.40, the recent high near ₹456.70, trading volume, RSI movements, profitability trends and subsequent quarterly results.