

Highlights
- Teamo Productions HQ is showing a notable change in its price structure after an extended period of weakness.
- June 2026 standalone total income stood at ₹3,395.98 lakh, while net profit reached ₹646.69 lakh.
- The stock opened at ₹0.65 and moved to a session high of ₹0.69, with a low of ₹0.61.
- The price is trading above the 50-day SMA of ₹0.46, indicating a change in its medium-term chart structure.
- Trading volume stood at 12.41 million shares, while VWAP was ₹0.66.
- Investors should monitor price stability, RSI, volume trends, financial performance and upcoming business developments.
Overview
Teamo Productions HQ Limited (NSE: TPHQ) is engaged in media, entertainment and related business activities. On August 19, 2026, the stock was trading at ₹0.67, compared with the previous close of ₹0.63. It opened at ₹0.65, touched a high of ₹0.69 and recorded a low of ₹0.61, while VWAP stood at ₹0.66. The latest movement marks a notable shift from the prolonged weakening structure visible across much of the year, with the stock recently moving above its 50-day SMA and advancing from the lower end of its recent trading range. Trading activity has also increased substantially during the latest phase. Overall market reaction is focused on whether this change can develop into a more stable price structure.
Fundamental View
For the quarter ended June 30, 2026, Teamo Productions HQ reported standalone total income of ₹3,395.98 lakh, profit before tax of ₹870.85 lakh and net profit of ₹646.69 lakh. Earnings per share stood at ₹0.06. The quarterly numbers indicate positive profitability alongside the reported income, although the sustainability of earnings remains an important factor for future assessment. Business performance will depend on developments across its operating segments, revenue generation, cost management and cash-flow position. Investors will continue to monitor subsequent quarterly results, margins, earnings quality and changes in the company's business operations.
Technical View
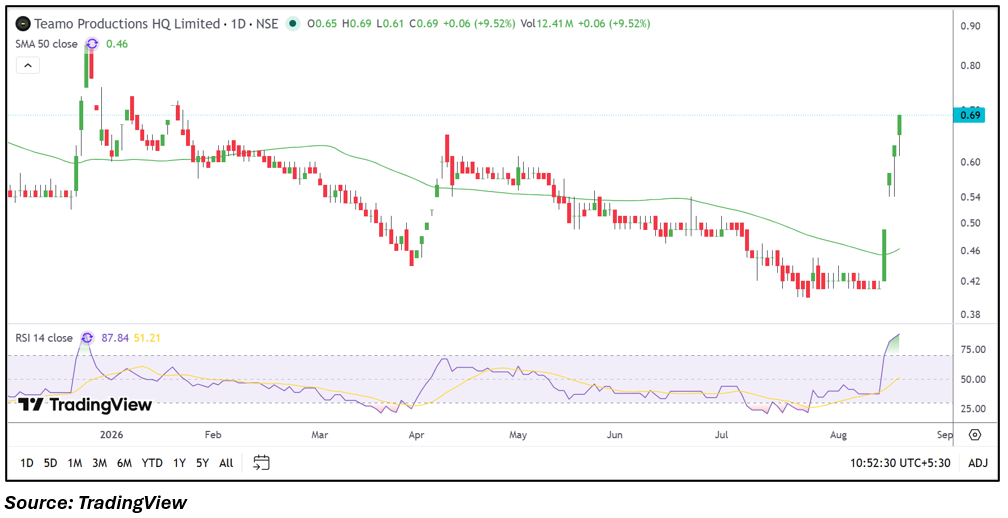
The daily chart shows a significant change from the prolonged declining structure, with the stock now positioned above the 50-day SMA of ₹0.46. The moving average had been trending lower for much of the earlier period but has started to turn upward as the price moved higher. RSI 14 is at 87.84, indicating highly elevated momentum and placing the indicator well above the 70 level. Volume has also expanded to 12.41 million shares, highlighting increased participation during the latest move. The current price structure has moved sharply away from the recent ₹0.40-₹0.50 trading area, making follow-through, volume behaviour and RSI movement important indicators for the next phase.
Key Technical Levels
Support is visible around ₹0.64, followed by ₹0.60. Resistance can be observed around ₹0.74, followed by ₹0.79. The 50-day SMA at ₹0.46 remains an additional medium-term technical reference. Price behaviour around these levels, together with trading volume and RSI, can provide context on the sustainability of the latest technical structure.
Risks to Watch
- The RSI at 87.84 indicates highly elevated momentum and potential for sharp fluctuations.
- The recent price movement has been accompanied by significant volatility.
- A decline in trading volume could affect the strength of the current price structure.
- The stock remains under the additional monitoring framework indicated by its ASM-1 series.
- Future quarterly results will be important for assessing the sustainability of reported profitability.
Summary
Teamo Productions HQ has experienced a notable change in its technical structure after months of weakness, with the stock now trading above its 50-day SMA of ₹0.46. The latest session recorded a high of ₹0.69 and volume of 12.41 million shares, while RSI at 87.84 reflects highly elevated momentum. Fundamentally, the June 2026 quarter reported standalone total income of ₹3,395.98 lakh, profit before tax of ₹870.85 lakh and net profit of ₹646.69 lakh, with EPS at ₹0.06. Going forward, price stability around the identified technical levels, volume trends, RSI behaviour, subsequent financial results and business developments will remain important areas to monitor.
FAQs
Q: Is Teamo Productions HQ entering a new technical phase?
A: The daily chart shows a notable shift from the earlier weakening structure, with the price now trading above its 50-day SMA.
Q: What is Teamo Productions HQ's 50-day SMA?
A: The 50-day SMA shown on the daily chart is ₹0.46.
Q: What was Teamo Productions HQ's net profit in June 2026?
A: The company reported a standalone net profit of ₹646.69 lakh for the quarter ended June 30, 2026.
Q: What is the current RSI of Teamo Productions HQ?
A: The 14-day RSI shown on the chart is 87.84.
Q: Which technical levels should be monitored for TPHQ?
A: Support can be monitored around ₹0.64 and ₹0.60, while resistance can be observed around ₹0.74 and ₹0.79.
 Source: TradingView