

Highlights
- The stock declined over 4% amid short-term selling pressure.
- Price remains above key moving average, indicating possible trend shift.
- Technical indicators show neutral momentum with improving structure.
Shares of Just Dial Limited (NSE:JUSTDIAL) were trading near ₹545.00, marking a decline of around 4.63% during the session. The stock opened at ₹564.00 compared to the previous close of ₹571.45 and touched an intraday high of ₹564.00, while the low stood at ₹543.10.
The VWAP was recorded at ₹548.09, suggesting trading activity remained close to current levels. The stock witnessed mild selling pressure after recent gains.
Returns Compared to Benchmark
Just Dial has underperformed the NIFTY Total Market index across most timeframes. Over the past week, the stock declined 3.68%, while the index gained 2.08%.
Monthly returns stand at 4.21%, slightly below the benchmark return of 5.76%. On a year-to-date basis, the stock declined 24.96%, compared to a fall of 5.46% in the index.
Over a one-year period, the stock declined 38.08%, while the index gained 6.03%. Longer-term returns also remain negative, with 3-year returns at -15.11% versus 52.25% for the benchmark.
Technical summary
Just Dial is trading near ₹545.00, down around 4.63%, but holds above the 21-day SMA near ₹527.32, indicating a recent attempt at a trend reversal. Despite the daily pullback, the formation of higher lows suggests improving sentiment. The 14-day RSI near 49.15 reflects neutral momentum. Immediate support is found in the ₹ 500-450 zone, while resistance is seen near ₹ 590-625.
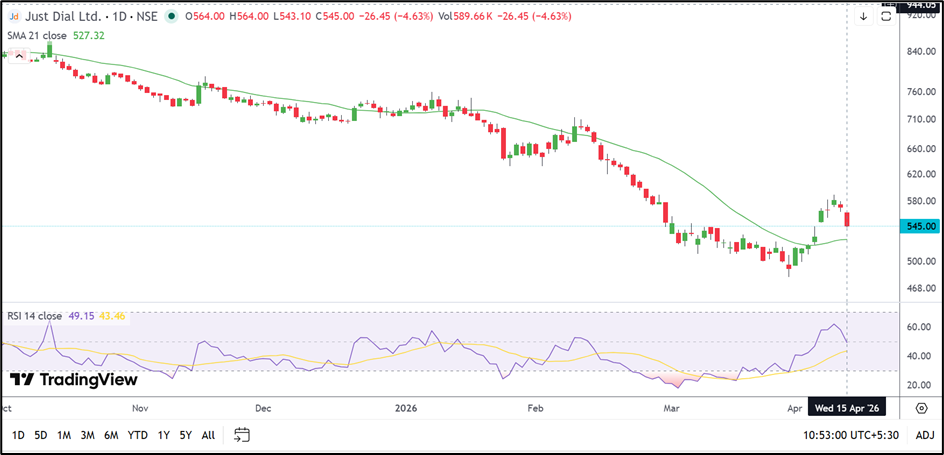
Source: TradingView
Business Overview
Just Dial Limited operates as a local search engine platform in India, providing search-related services across multiple channels.
Its offerings include mobile applications, desktop platforms, voice-based services, and text-based search, catering to users seeking local business information.
Trading and Volatility Indicators
The company has a total market capitalisation of ₹4,634.93 crore and a free float market cap of ₹1,197.73 crore. Traded volume during the session was 8.05 lakh shares, translating into a traded value of ₹44.12 crore.
Impact cost stands at 0.07, indicating relatively good liquidity. Daily volatility is recorded at 2.21%, while annualised volatility stands at 42.22%, reflecting moderate price fluctuations.
The deliverable quantity stands at 57.14% of traded volume, indicating a balance between delivery-based and intraday participation.
Key Risks
- Weak long-term returns indicate sustained underperformance.
- Resistance near ₹590–₹625 may cap near-term upside.
- Market competition in digital platforms may impact growth.
- Negative sentiment in recent periods may affect price movement.
Summary
Just Dial Limited shares declined during the session but continue to hold above key moving averages, indicating a potential shift in short-term trend. While performance remains weaker compared to the benchmark across longer periods, technical indicators suggest improving structure with neutral momentum. Support and resistance levels remain critical for near-term direction.
FAQs
- Why did Just Dial stock fall today?
The stock declined due to short-term selling pressure after recent gains near resistance levels. - What do technical indicators suggest for Just Dial stock?
RSI shows neutral momentum, with support near ₹500–₹450 and resistance around ₹590–₹625 levels. - How has Just Dial performed recently?
The stock has underperformed the broader market across most timeframes, especially over one-year and three-year periods.