
Highlights
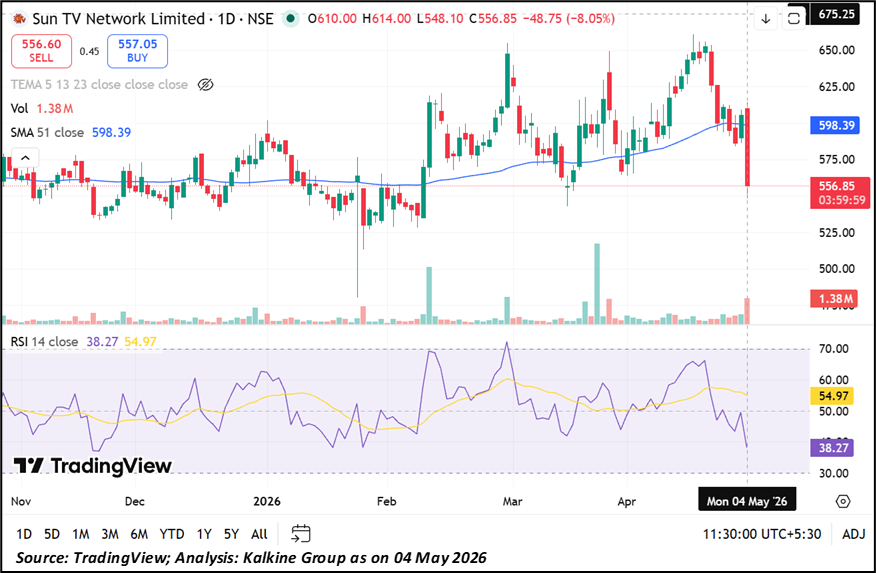
- The stock declined over 8% and is trading near ₹556.85 level.
- RSI near 38 shows weak momentum and nearing oversold zone.
- Price slipped below 51-day SMA, indicating short-term weakness.
Shares of Sun TV Network Limited (NSE:SUNTV) saw a notable fall in the latest session. The stock dropped around 8.05% to ₹556.85, compared to the previous close of ₹605.60. It opened higher at ₹610.00 but faced selling pressure, falling to an intraday low of ₹548.10 before recovering slightly.
The traded volume stood at 13.79 lakh shares, with a traded value of ₹77.74 crore. The company has a total market cap of ₹21,950.51 crore and a free float market cap of ₹5,486.85 crore, showing large-cap positioning in the media sector.
Technical Indicators Show Weak Trend
The stock has slipped below its 51-day simple moving average (SMA) near ₹598.39, which suggests weakness in the short-term trend. The 14-day RSI is around 38.27, indicating weak momentum and approaching oversold levels.
Immediate support is placed between ₹525.00 and ₹540.00. On the upside, resistance is seen in the ₹600.00 to ₹650.00 range. The stock may move within this range in the near term.
Returns Lag Sector Performance
The stock has underperformed its sector in recent periods. In one week, it declined 8.90%, compared to a 1.45% fall in the NIFTY MEDIA index.
In one month, the stock fell 6.51%, while the sector index gained 11.29%. Year-to-date, it is down 5.20%, compared to a slight gain of 0.14% in the index. Over one year, the stock declined 11.48%.
However, over three years, it has gained 27.18%, and over five years, it has delivered 13.58%, showing moderate long-term performance.
Trading Activity Remains Stable
The stock has stable trading activity with a low impact cost of 0.06, indicating good liquidity. The deliverable quantity stands at 36.86%, showing a mix of delivery-based and short-term trades.
Annualised volatility is 39.93, which is lower compared to many mid-cap stocks, suggesting relatively moderate price swings.
Key Risks to Monitor
- Breakdown below SMA may signal further weakness.
- RSI near 38 shows weak momentum.
- Continued underperformance versus sector may persist.
- Price near support increases risk of further downside.
Technical Summary
Sun TV Network Limited (NSE:SUNTV) is trading near ₹556.85, down around 8.05%, and has slipped below its 51-day SMA near ₹598.39, while the 14-day RSI near 38.27 points. Immediate support is now placed in the ₹525.00–₹540.00 zone, while resistance is seen back toward the ₹600.00–₹650.00 range.
Summary
Sun TV Network Limited (NSE:SUNTV) stock fell over 8% to ₹556.85 and moved below its 51-day SMA, indicating short-term weakness. RSI shows weak momentum and is nearing oversold levels. The stock has underperformed its sector in recent periods. Support is placed near ₹525–₹540, while resistance is seen between ₹600 and ₹650 levels in the near term.
FAQs
- Why did Sun TV stock fall today?
The stock declined due to selling pressure and weakness in price trend, leading to a drop below its short-term average. - What does RSI near 38 indicate?
RSI near 38 shows weak momentum and suggests the stock is moving closer to oversold conditions. - What levels should investors track now?
Support is between ₹525 and ₹540, while resistance is expected in the ₹600 to ₹650 range.