
Highlights
- Stock trades near 52-week high with intraday range reflecting elevated volatility.
- Returns outperform NIFTY 500 on YTD and medium-term basis despite mixed long-term trends.
- Financials show stable profitability with steady earnings per share in latest quarter.
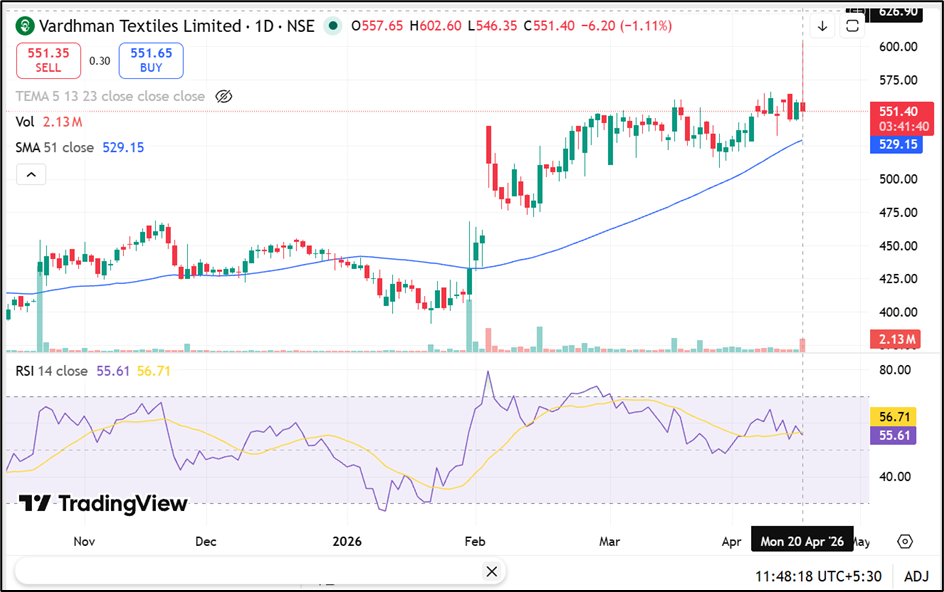
Vardhman Textiles (NSE:VTL) Limited is currently trading close to its 52-week high of INR 602.60, with the stock recording an intraday high at the same level. The session witnessed movement between INR 546.35 and INR 602.60, indicating a wide trading range and heightened volatility.
The previous close stood at INR 557.60, while the volume-weighted average price (VWAP) was INR 570.71. Daily volatility is reported at 2.31%, with annualised volatility at 44.13%, suggesting active price fluctuations.
Return Metrics Show Mixed Trends
On a shorter horizon, the stock has delivered modest gains, with 1-week returns at 0.67% and 1-month returns at 3.57%. Year-to-date performance stands at 26.75%, significantly outperforming the NIFTY 500, which has declined 3.97% over the same period.
Over a one-year period, the stock has returned 9.81%, while 3-year returns stand at 76.79%, indicating medium-term appreciation. However, the 5-year return remains negative at -52.38%, reflecting longer-term pressure.
Trading Activity and Liquidity Indicators
The stock recorded traded volume of 21.27 lakh shares, translating into a traded value of INR 121.42 crore. Deliverable quantity stood at 31.37%, suggesting a mix of short-term and positional participation.
Market capitalisation is reported at INR 15,966.91 crore, with a free float market cap of INR 5,601.20 crore. The impact cost remains low at 0.07, indicating relatively efficient trade execution.
Financial Performance Snapshot
For the quarter ended December 31, 2025, standalone total income stood at INR 2,53,327 lakh, while net profit was INR 16,995 lakh, resulting in earnings per share of INR 5.88.
On a consolidated basis, total income was INR 2,56,379 lakh with net profit at INR 16,850 lakh and EPS at INR 5.85. The figures indicate stable earnings performance during the period.
Business Overview and Market Presence
Vardhman Textiles operates across yarn, fabric, acrylic fiber, and garments manufacturing. The company has expanded its footprint across domestic and international markets, with presence in over 75 countries.
Its diversified product portfolio and global reach position it within multiple segments of the textile value chain, contributing to revenue streams across geographies.
Technical Summary
Vardhman Textiles Limited is trading near ₹551.40, down around 1.11% on 20 April 2026, and continues to hold well above the 51-day SMA near ₹529.15, while the 14-day RSI near 55.61 points. Immediate support is placed in the ₹530.00–500.00 zone, while resistance is seen near the ₹575.00–600.00 range.
Key Risks
- Exposure to raw material price fluctuations may impact margins.
- Demand variability in global textile markets could affect revenues.
- Currency movements may influence export realizations.
- High volatility levels may lead to short-term price swings.
Summary
Vardhman Textiles (NSE:VTL) is trading near its 52-week high with notable volatility and active trading participation. The stock has delivered strong year-to-date and medium-term returns compared to the broader market, though long-term performance remains uneven.
Financials indicate stable earnings, while business operations continue across multiple textile segments with global market exposure.
FAQs
- Why is Vardhman Textiles stock near its 52-week high?
The stock has seen price momentum supported by returns performance and active trading, pushing it close to its recent peak levels. - How has the stock performed compared to the NIFTY 500?
It has outperformed the NIFTY 500 on a year-to-date basis, though long-term returns remain comparatively lower. - What are the key financial highlights of the latest quarter?
The company reported stable income and profitability with EPS near INR 5.8 on both standalone and consolidated basis.