

Highlights
- Yasho Industries witnessed a sharp 8.75% decline on August 19, 2026.
- June quarter total income stood at ₹309.06 crore, while net profit reached ₹36.05 crore.
- The stock opened at ₹4,910.00 and touched a low of ₹4,486.50 during the session.
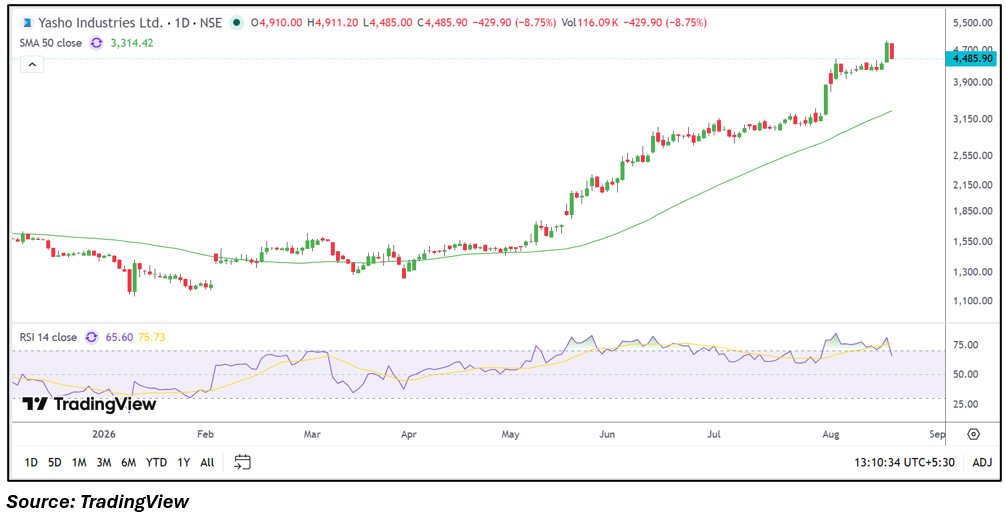
- The price remains above the 50-day SMA of ₹3,314.42 despite the latest correction.
- Trading volume stood at 116.09K shares, with VWAP at ₹4,666.19.
- Investors should monitor the ₹4,486.50 zone, recent highs, RSI and volume behaviour.
Overview
Yasho Industries Limited (NSE: YASHO) is a specialty chemicals company serving industrial applications across multiple markets. On August 19, 2026, the stock opened at ₹4,910.00, moved to a high of ₹4,911.20 and declined to a low of ₹4,486.50. The current price was ₹4,485.90, down ₹429.90 or 8.75%, while VWAP stood at ₹4,666.19. The session followed a period of substantial price appreciation visible on the daily chart, with the stock recently trading close to the ₹4,700-₹4,900 region. The sharp decline has therefore changed the short-term price structure, while the overall market reaction is focused on the magnitude of the correction and whether the stock can maintain higher price zones.
Fundamental View
For the quarter ended June 30, 2026, Yasho Industries reported consolidated total income of ₹309.06 crore, profit before tax of ₹48.97 crore and net profit of ₹36.05 crore. Earnings per share stood at ₹29.90. Based on reported total income, the profit before tax margin was approximately 15.84%, while the net profit margin was approximately 11.66%. The results provide a key reference point for evaluating the company's specialty chemicals operations, with future performance dependent on product demand, capacity utilisation, raw-material costs, export activity and product mix. Investors will also monitor whether earnings growth remains consistent with the stock's elevated market valuation and recent price performance.
Technical View
The daily chart shows that Yasho Industries continues to trade well above its 50-day SMA of ₹3,314.42, keeping the broader price structure considerably above its medium-term average. However, the latest session produced a large red candle after the stock traded near ₹4,900, indicating a sharp short-term pullback. RSI 14 stands at 65.60, showing that momentum remains above the midpoint even after the latest decline. Trading volume was 116.09K shares, while the stock remained below its session VWAP of ₹4,666.19. The recent price action indicates a loss of short-term momentum, with the reaction around recent trading zones becoming important for the next phase of the chart.
Key Technical Levels
The ₹4,486.50 area is visible as the latest session low and an important near-term reference point. Below this zone, the chart shows a visible price area around ₹4,200, followed by the ₹3,900 region where earlier price activity developed. On the upside, ₹4,666.19 represents the current VWAP level, while the ₹4,900-₹4,911.20 zone corresponds with the latest session's opening and high levels. The 50-day SMA at ₹3,314.42 remains a broader trend reference visible on the chart.
Risks to Watch
- A sustained move below recent price zones could alter the short-term technical structure.
- Elevated volatility may continue following the stock's sharp recent price movements.
- Changes in specialty chemical demand could affect future revenue growth.
- Higher raw-material and operating costs could influence margins.
- Valuation and earnings growth will remain important factors for market assessment.
Summary
Yasho Industries is undergoing a sharp correction after opening at ₹4,910.00 and falling to ₹4,486.50, with the stock trading at ₹4,485.90 and down 8.75%. The broader chart remains above the 50-day SMA of ₹3,314.42, although the latest large red candle indicates weaker short-term momentum. RSI at 65.60 remains above the midpoint, while volume of 116.09K shares highlights active trading during the decline. Fundamentally, the June 2026 quarter recorded total income of ₹309.06 crore and net profit of ₹36.05 crore. Future monitoring will centre on earnings, margins, price behaviour around visible levels, volume trends and the sustainability of the company's financial performance.
FAQs
Q: What happened to Yasho Industries stock on August 19, 2026?
A: Yasho Industries declined 8.75% to ₹4,485.90, after opening at ₹4,910.00 and touching an intraday low of ₹4,486.50.
Q: What was Yasho Industries' net profit in the June 2026 quarter?
A: The company reported consolidated net profit of ₹36.05 crore for the quarter ended June 30, 2026.
Q: What is the 50-day SMA of Yasho Industries?
A: The 50-day SMA shown on the daily chart is ₹3,314.42.
Q: What is the current RSI of YASHO stock?
A: The RSI 14 reading shown on the chart is 65.60.
Q: Which price levels are visible on the Yasho Industries chart?
A: The latest low of ₹4,486.50 is a key near-term reference, while ₹4,200 and ₹3,900 are lower visible zones. On the upside, ₹4,666.19 and the ₹4,900-₹4,911.20 region are visible reference levels.