
Highlights
- JAINREC gained over 8% after a steep correction from recent highs.
- The stock witnessed a rebound attempt despite trading below its 50-day SMA.
- RSI recovered from weaker levels, indicating improving short-term momentum.
Overview
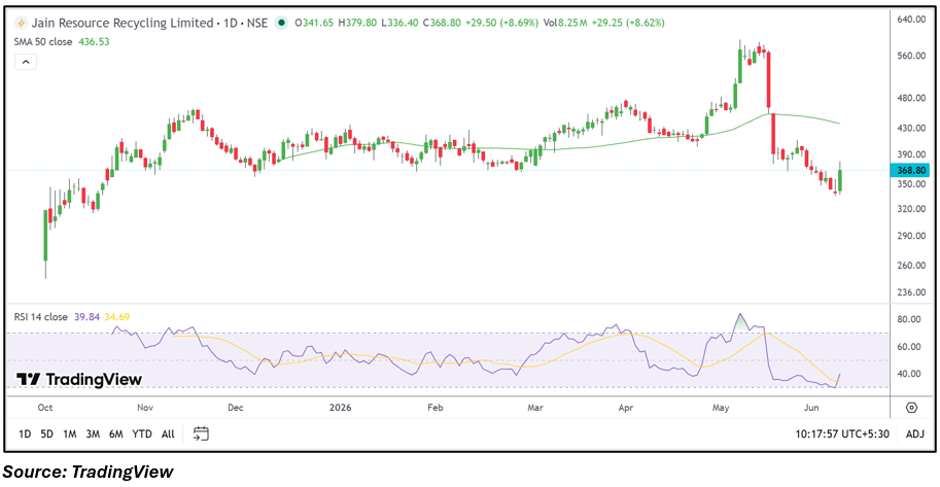
Jain Resource Recycling (NSE: JAINREC) rose 8.50% to ₹368.15 on June 9, emerging among the day's top gainers. The recovery comes after a sharp correction that pulled the stock significantly lower from its recent peak. The strong intraday move suggests buyers have returned near lower levels, although the broader trend remains under watch following the recent volatility.
Fundamental View
For the quarter ended March 2026, the company reported consolidated total income of INR 3,11,466.10 lakh. Profit before tax stood at INR 8,898.60 lakh, while net profit came in at INR 6,603.00 lakh. Earnings per share were reported at INR 1.91. The latest results indicate the company remained profitable, supported by healthy operating performance during the quarter.
Technical View
JAINREC traded at ₹368.15 while remaining below its 50-day SMA of ₹436.53, indicating that the broader medium-term structure has not yet fully recovered. The stock recently witnessed a steep correction before attracting buying interest near the ₹340.00 zone. The 14-day RSI improved to 39.84 from lower levels, suggesting selling pressure has eased. However, a sustained recovery above key moving averages would be needed to strengthen the technical outlook further.
Momentum Indicator
The RSI reading of 39.84 remains below the neutral 50 mark but has rebounded from weaker levels. This suggests momentum is stabilizing, although confirmation of a stronger trend shift is still awaited.
Key Technical Levels
On the downside, immediate support is placed near ₹349.74, while the next support zone is seen around ₹331.34. On the upside, the stock may face resistance near ₹386.56, followed by a higher hurdle around ₹404.97. Sustaining above the first resistance zone could improve near-term sentiment, while a move below support levels may invite renewed selling pressure.
Key Investment Risks
Jain Resource Recycling remains exposed to fluctuations in scrap metal and recycled commodity prices, which can affect margins. The business is also sensitive to industrial demand trends and global commodity cycles. Changes in environmental regulations, recycling policies, and raw material availability could influence future earnings performance and operational efficiency.
Summary
Jain Resource Recycling staged a notable rebound after a sharp correction, helping the stock emerge among the day's top gainers. While profitability remained healthy in the latest quarter, the stock continues to trade below its 50-day SMA, indicating that the broader recovery is still evolving. Investors may watch whether the stock can sustain momentum above nearby resistance levels in the coming sessions.
FAQs
- Why did Jain Resource Recycling shares rise today?
The stock rebounded after a recent correction, attracting buyers near lower levels and driving a strong recovery.
- Is JAINREC still below its 50-day SMA?
Yes, the stock is trading below its 50-day SMA of ₹436.53 despite the latest rebound.
- What are the key levels to watch?
Support is located near ₹349.74 and ₹331.34, while resistance is positioned around ₹386.56 and ₹404.97.