
Highlights
- Jamna Auto Industries reported Q4 net profit of INR 8,475.50 lakh.
- The stock declined over 6% despite reporting profitable quarterly earnings.
- Price slipped below the 21-day SMA, indicating weakening near-term momentum.
Overview
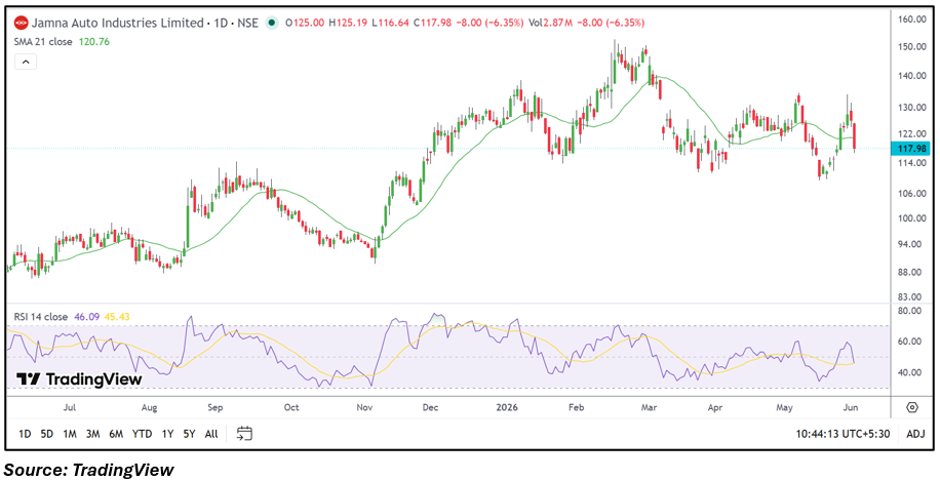
Jamna Auto Industries (NSE: JAMNAAUTO) came under selling pressure on June 2, 2026, with the stock falling 6.35% to INR 117.98. The decline occurred despite the company reporting profitable Q4 FY26 results, highlighting a cautious market reaction after the recent recovery in the stock price. Investors appeared to focus on near-term price action as the stock moved below key moving average levels.
Fundamental View
For the quarter ended March 31, 2026, Jamna Auto Industries reported total income of INR 82,585.26 lakh. Profit before tax stood at INR 11,247.23 lakh, while net profit came in at INR 8,475.50 lakh. Earnings per share were reported at INR 2.13.
The latest results indicate that the company remained profitable during the quarter. However, stock price movements following earnings announcements are often influenced by broader market sentiment, valuation expectations, and profit-booking activity rather than earnings figures alone.
Technical View
Jamna Auto Industries is trading at INR 117.98, down 6.35% for the session. The stock has slipped below its 21-day SMA of INR 120.76, reflecting a weaker near-term technical structure. Recent price action indicates renewed selling pressure after the stock failed to sustain gains near the INR 130 region. The RSI stands at 46.09, hovering below the neutral 50 mark and suggesting a moderation in momentum. A sustained move back above the 21-day SMA may improve near-term sentiment, while continued trading below this level could keep the stock under pressure.
Momentum Indicator
The 14-day RSI is at 46.09, below the neutral 50 level. This suggests momentum has weakened compared with recent weeks, though the indicator has not yet entered oversold territory.
Key Technical Levels
Based on the current price of INR 117.98, immediate support is placed near INR 112.08, representing approximately 5% below current levels. A deeper support zone is visible near INR 106.18, which is around 10% below the current market price. On the upside, the first resistance level is positioned near INR 123.88, about 5% above the current price. If buying interest returns, the next resistance zone may emerge near INR 129.78, representing roughly 10% upside from current levels.
Risks to Watch
- Sustained trading below the 21-day SMA.
- Volatility in commercial vehicle demand.
- Margin pressure from raw material cost fluctuations.
- Broader market weakness impacting auto ancillary stocks.
Summary
Jamna Auto Industries reported profitable Q4 FY26 results with net profit of INR 8,475.50 lakh and EPS of INR 2.13. Despite the earnings performance, the stock witnessed a sharp decline and moved below its 21-day SMA. Technical indicators suggest weakening momentum, while investors may monitor support zones and broader sector sentiment for signs of stabilization.
FAQs
- What was Jamna Auto Industries' Q4 FY26 net profit?
The company reported net profit of INR 8,475.50 lakh for the quarter ended March 2026.
- Why did JAMNAAUTO shares decline despite profitable results?
The decline may reflect profit booking, valuation concerns, and broader market sentiment rather than earnings alone.
- What is the key technical level to watch?
Investors may watch the 21-day SMA near INR 120.76 and nearby support zones for direction.