
Highlights
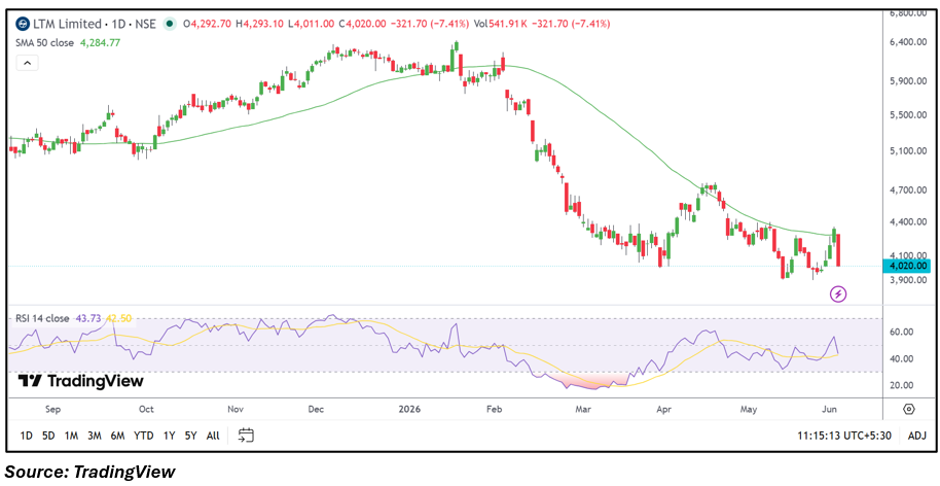
- LTM shares fell more than 7% and slipped below the 50-day SMA.
- Recent rebound attempt lost momentum near a key resistance zone.
- RSI remained below the neutral mark, indicating weak momentum conditions.
Overview
LTM (NSE: LTM) came under renewed selling pressure on June 3, with the stock declining 7.35% to ₹4,022.50. The sharp fall erased a large portion of the recent recovery move and pushed the stock back below an important technical resistance area. The decline occurred despite the company reporting standalone net profit of INR 1,32,170 lakh and earnings per share of INR 44.59 for the quarter ended March 2026.
Fundamental View
LTM reported standalone total income of INR 10,95,930 lakh during the March 2026 quarter, while profit before tax stood at INR 1,78,360 lakh. Net profit came in at INR 1,32,170 lakh with earnings per share of INR 44.59. While the company remains profitable, the stock's recent movement appears primarily driven by market sentiment and technical factors rather than fresh earnings-related developments.
Technical View
LTM traded at ₹4,022.50 and remained below its 50-day SMA of ₹4,284.77, reflecting a weak intermediate-term technical structure. Recent price action shows that the stock attempted a recovery from its April lows but failed to sustain momentum near the moving-average resistance zone. The latest decline suggests that sellers regained control after the recent bounce.
The 14-day RSI stood at 43.73, remaining below the neutral 50 level. This indicates subdued momentum and suggests that the recovery phase has lost strength, while the broader corrective structure remains intact.
Key Technical Levels
On the downside, immediate support is placed near ₹3,821.38. If this level fails to hold, the next important support zone is positioned around ₹3,620.25.
On the upside, immediate resistance is seen near ₹4,223.63. A sustained move above this level could bring the next resistance area near ₹4,424.75 into focus.
Risks to Watch
- Sustained trading below the 50-day SMA.
- Weak momentum reflected by RSI below 50.
- Failure of recent recovery attempts.
- Increased volatility around key support zones.
Summary
LTM shares witnessed a sharp decline and slipped further below their 50-day SMA, indicating that the broader corrective trend remains intact. Although the company reported profitable quarterly results, the stock has struggled to maintain its recent rebound and continues to face resistance near higher levels. Traders will likely watch the ₹3,821 and ₹3,620 support zones for signs of stabilization, while a move above ₹4,224 could improve the near-term outlook.
FAQs
Why did LTM stock fall over 7% today?
The decline appears driven by renewed selling pressure after the stock failed to sustain its recent recovery attempt.
Is LTM still in a downtrend?
The stock remains below its 50-day SMA, suggesting the broader corrective trend is still active.
What levels should traders monitor?
Key support levels are ₹3,821.38 and ₹3,620.25, while resistance is located near ₹4,223.63 and ₹4,424.75.