
Highlights
- MCX shares declined 4.03% while trading close to its 50-day moving average.
- The stock is currently hovering near ₹ 2,431.46, acting as a key support level.
- RSI at 46.02 indicates weakening momentum after a sustained uptrend.
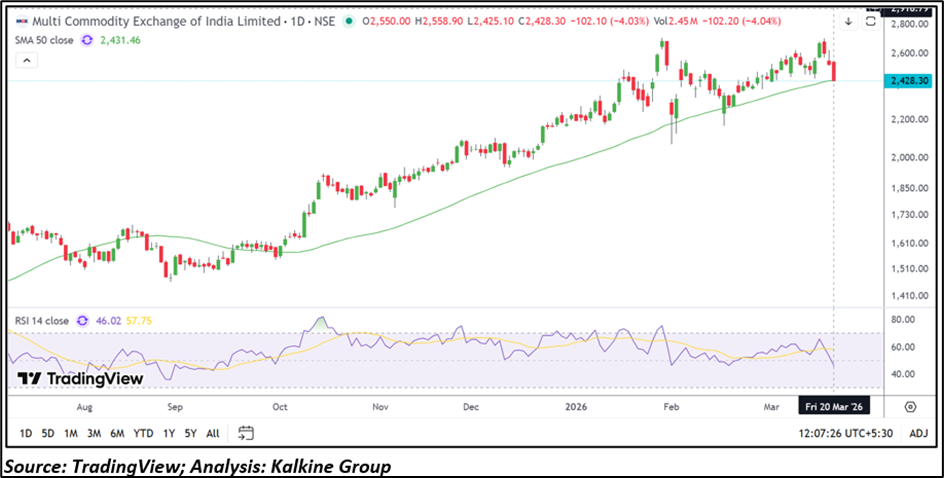
Multi Commodity Exchange of India Limited (NSE:MCX) is trading around ₹ 2,428.30, down approximately 4.03% as of March 20, 2026. The stock is hovering near its 50-day simple moving average at ₹ 2,431.46, which is acting as a key near-term support level. The current price structure indicates a pause following a sustained uptrend, with recent candles reflecting mild profit booking at higher levels.
Sector Context and Industry Trends
MCX operates in the commodity exchange segment, which is influenced by trading volumes in commodities such as metals, energy, and agricultural products. The sector depends on market participation, global commodity price movements, and regulatory frameworks. Growth in trading activity and financial market participation plays an important role in the performance of exchange-based businesses.
Financial Overview
No specific financial data is provided in the latest update. However, companies in the exchange sector typically generate revenue through transaction fees, clearing and settlement services, and trading volumes. Performance is often linked to activity levels across commodity markets and overall market participation.
Volume and Trading Activity
The recent price decline has been accompanied by trading activity that suggests profit booking after a sustained upward move. Elevated volumes during a pullback phase may indicate distribution, although further observation is required to confirm trend direction. Sustained volume patterns will help determine whether the stock stabilizes or continues lower.
Technical Analysis
Multi Commodity Exchange of India Limited (ASX:MCX) is trading around ₹2,428.30, down 4.03% as of March 20, 2026, and is hovering near its 50-day SMA at ₹2,431.46, which is acting as a key near-term support level. The price structure indicates a pause after a sustained uptrend, with recent candles reflecting mild profit booking near higher levels.
Momentum has softened, with the RSI at 46.02, suggesting easing strength. Immediate support is placed near ₹2,200.00 and ₹2,000.00, while resistance is seen near ₹2,650.00 and ₹2,850.00, where price may face near-term hurdles if recovery attempts emerge.
Outlook Considerations
The price action suggests a pause in the previous uptrend, with short-term momentum easing. The ability to hold above the 50-day moving average will be important for near-term stability. Market participants may track commodity trading activity, market participation, and broader financial market trends to assess future direction.
Risk Factors
- Weakening momentum and loss of upward trend strength
- Potential decline if support near moving average is breached
- Dependence on trading volumes and market participation
- Volatility due to broader market and commodity price movements
Conclusion
MCX stock has entered a consolidation phase after a sustained uptrend, with price currently near a key moving average support level. Momentum has softened, and the near-term direction will depend on whether the stock can hold support or face further correction. Key resistance levels will determine the potential for recovery.
MCX shares declined 4.03% to ₹ 2,428.30, trading near the 50-day SMA at ₹ 2,431.46, which acts as key support. The stock shows a pause after a sustained uptrend with RSI at 46.02, indicating weakening momentum. Support is placed near ₹ 2,200 and ₹ 2,000, while resistance levels are seen around ₹ 2,650 and ₹ 2,850.
FAQs
- Why did MCX stock decline recently?
The stock declined due to mild profit booking after a sustained uptrend and easing momentum. - What are the key technical levels for MCX?
Support is near ₹ 2,431, ₹ 2,200, and ₹ 2,000, while resistance is placed at ₹ 2,650 and ₹ 2,850. - What does the RSI indicate for MCX?
The RSI at 46.02 indicates weakening momentum and a shift toward a neutral-to-weaker trend.