

Highlights
- Naga Dhunseri Group shares surged 20.00% to hit the upper circuit at ₹3,150.00.
- The stock attracted investor attention despite reporting a consolidated net loss in the latest quarter.
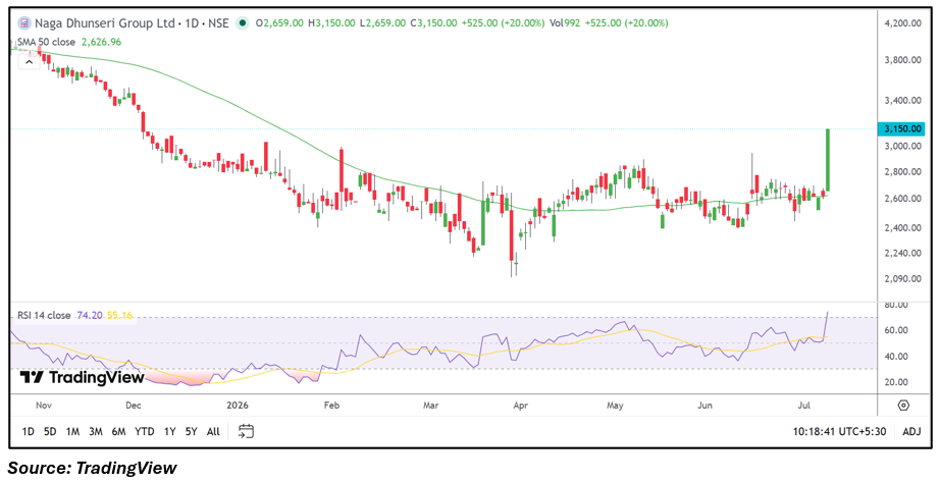
- NDGL traded well above its 50-day moving average, reflecting a notable improvement in price structure.
- RSI climbed above 74, indicating a sharp increase in momentum after the breakout.
- Trading activity remained elevated as the stock emerged among the session's top gainers.
- Investors will monitor whether the stock can sustain the latest breakout in the coming sessions.
Overview
Naga Dhunseri Group Limited came into focus after its shares rallied 20.00% to the upper circuit at ₹3,150.00. The stock opened at ₹2,659.00 and remained locked at its intraday high throughout the session, reflecting significant buying activity. Although there was no major corporate announcement accompanying the move, the sharp rise placed the stock among the market's top performers, with participants closely watching whether the momentum continues.
Fundamental View
For the quarter ended 31 March 2026, Naga Dhunseri Group reported consolidated total income of ₹7,312.19 lakh. The company posted a loss before tax of ₹3,733.15 lakh and a net loss of ₹4,052.88 lakh, resulting in earnings per share of negative ₹267.50. While the recent financial performance remained under pressure, investors are likely to monitor future earnings, operational developments, and any corporate announcements that could influence the company's financial trajectory.
Technical View
NDGL traded well above its 50-day moving average of ₹2,626.96 after the sharp breakout. The RSI climbed to around 74.20, indicating a significant pickup in momentum following the upper circuit move. The breakout was accompanied by higher trading interest, suggesting increased market participation. The stock's ability to maintain levels above recent breakout zones will remain an important factor in assessing the near-term technical structure.
Key Technical Levels
Immediate support is placed near ₹3,071.25, followed by the next support around ₹2,992.50. On the upside, immediate resistance is seen near ₹3,150.00, while the next resistance is positioned around ₹3,307.50 if the stock extends its upward move.
Risks to Watch
- Continued quarterly losses.
- Limited liquidity due to low trading participation.
- Sharp price volatility following the recent rally.
- Any adverse corporate or regulatory developments.
- Broader market sentiment affecting small-cap stocks.
Summary
Naga Dhunseri Group delivered one of the session's strongest moves after hitting the 20% upper circuit, bringing the stock back into market focus. While the recent rally reflects renewed trading interest and improving technical momentum, the company's latest quarterly results indicate that financial performance remains under pressure. Investors are likely to track future earnings, corporate developments, trading volumes, and price action around key technical levels.
FAQs
Q: Why did Naga Dhunseri Group shares hit the 20% upper circuit?
A: The rally was driven by strong market participation and renewed momentum, although no major corporate announcement accompanied the move.
Q: How did the company perform in its latest quarter?
A: Naga Dhunseri Group reported consolidated total income of ₹7,312.19 lakh and a net loss of ₹4,052.88 lakh for the quarter ended 31 March 2026.
Q: Is the stock trading above its 50-day moving average?
A: Yes. The stock is trading above its 50-day moving average of ₹2,626.96, indicating an improved medium-term price structure.
Q: What does the RSI indicate?
A: The RSI of around 74.20 suggests momentum has strengthened following the sharp rally.
Q: What should investors monitor going forward?
A: Investors may watch upcoming corporate announcements, quarterly earnings, trading volumes, and whether the stock sustains its recent breakout levels.