
Highlights
- Nova Agritech shares declined 10.39%, continuing a steady downtrend pattern.
- The stock trades below its 50-day SMA near ₹ 31.37, now acting as resistance.
- RSI at 22.55 indicates oversold conditions with weak short-term momentum.
Nova Agritech Limited (NSE:NOVAAGRI) is trading around ₹ 22.94, marking a decline of approximately 10.39% as of March 20, 2026. The stock remains below its 50-day simple moving average near ₹ 31.37, which now acts as a key resistance level. The price structure reflects a steady downtrend, with a recent breakdown below nearby support levels, indicating continued pressure on the chart.
Sector Context and Industry Trends
Nova Agritech operates in the agribusiness sector, which is influenced by agricultural demand, input costs, and monsoon conditions. The sector is closely tied to crop cycles, government policies, and rural economic activity. Growth in agritech and improved farming practices continue to shape long-term trends, although near-term performance may be affected by seasonal and environmental factors.
Financial Overview
No specific financial data is provided in the latest update. However, companies in the agritech segment typically depend on product demand, distribution reach, and cost efficiency. Financial performance is often influenced by input costs, crop cycles, and market demand for agricultural solutions and services.
Volume and Trading Activity
The stock’s decline has been accompanied by trading activity that reflects sustained selling pressure. Increased volume during a downtrend may indicate continued distribution, although confirmation depends on whether activity persists alongside price weakness. Monitoring future volume trends will be important for assessing stabilization or further decline.
Technical Analysis
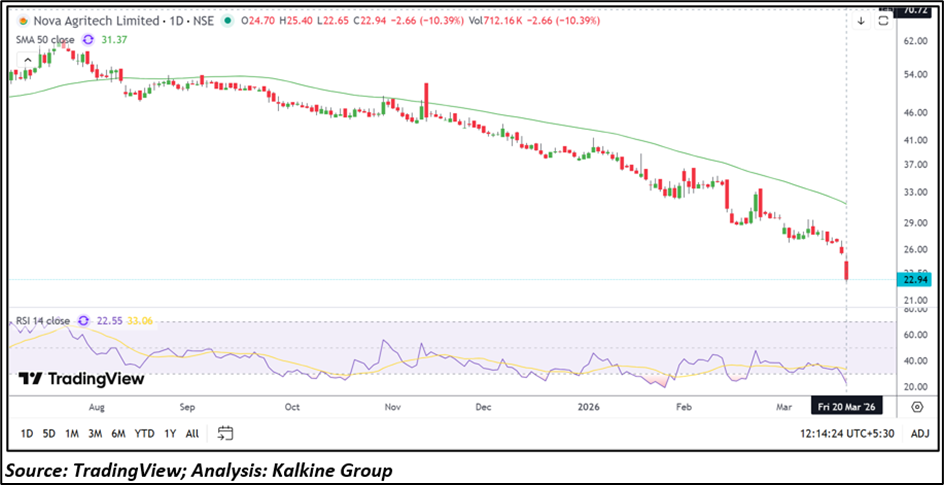
Nova Agritech Limited is trading around ₹22.94, down 10.39% as of March 20, 2026, and remains below its 50-day SMA near ₹31.37, which continues to act as a key resistance level. The price structure reflects a steady downtrend with a recent breakdown below nearby support levels, indicating continued pressure on the chart.
Momentum remains weak, with the RSI at 22.55, positioned in the oversold zone. Immediate support is placed near ₹20.00 and ₹18.00, while resistance is seen near ₹25.00 and ₹28.00, where price may face initial hurdles on any recovery.
Outlook Considerations
The current structure suggests continued weakness, with the stock firmly in a downtrend. Oversold conditions may lead to short-term relief rallies, but sustained recovery would require reclaiming key resistance levels. Market participants may monitor sector demand, input costs, and operational performance to evaluate future direction.
Risk Factors
- Continued weakness due to prolonged downtrend
- Dependence on agricultural cycles and monsoon conditions
- Limited momentum despite oversold RSI levels
- Risk of further decline if support levels are breached
Conclusion
Nova Agritech Ltd is trading at lower levels within a clear downtrend, with weak momentum and oversold conditions reflected in the RSI. The stock remains below its key moving average, and near-term direction will depend on whether it can stabilize above support or face further downside pressure.
Nova Agritech shares declined 10.39% to ₹ 22.94, remaining below the 50-day SMA near ₹ 31.37, which now acts as resistance. The stock continues in a downtrend with RSI at 22.55, indicating oversold conditions. Support is placed near ₹ 20 and ₹ 18, while resistance is seen around ₹ 25 and ₹ 28 levels.
FAQs
- Why did Nova Agritech stock fall recently?
The stock declined due to a continued downtrend and breakdown below key support levels. - What are the key technical levels for Nova Agritech?
Support is near ₹ 20 and ₹ 18, while resistance is placed at ₹ 25 and ₹ 28. - What does the RSI indicate for this stock?
The RSI at 22.55 indicates oversold conditions with weak momentum in the short term.