

Highlights
- Pace Digitek (NSE: PACEDIGITK) declined 6.72% after its June 2026 quarter financial results.
- Standalone total income stood at ₹28,313.10 million, while net profit came in at ₹4,251.40 million.
- The stock opened at ₹191.50, touched an intraday high of ₹193.90, a low of ₹186.14, and traded at ₹187.33.
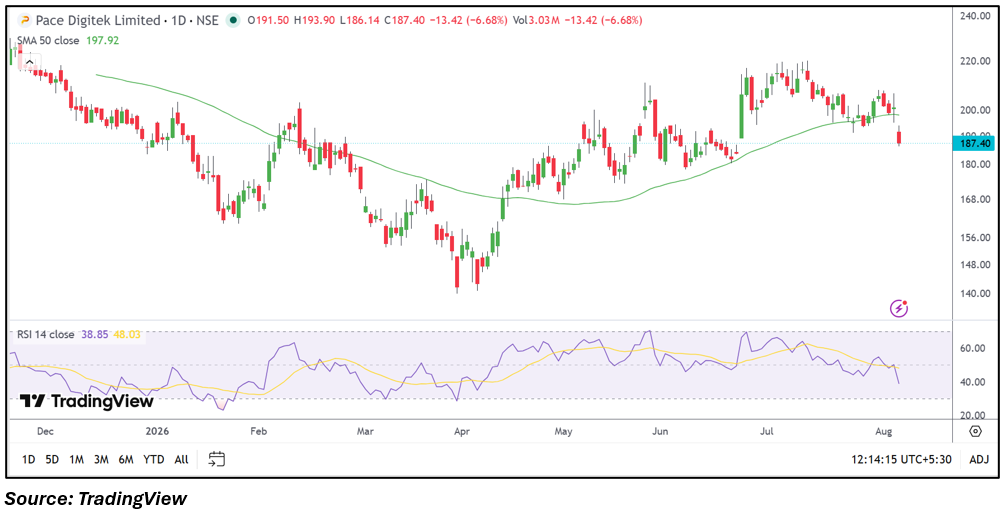
- The decline pushed the stock below its 50-day SMA, indicating a weakening near-term technical structure.
- Trading activity remained elevated as investors reacted to the latest quarterly earnings.
- Investors may monitor price action around key support levels along with future order execution and earnings performance.
Overview
Pace Digitek (NSE: PACEDIGITK) operates in the electrical infrastructure and engineering sector, offering services across power distribution, transmission, and EPC projects. The stock came under pressure during Thursday's trading session despite reporting healthy June 2026 quarter results. It opened at ₹191.50, touched an intraday high of ₹193.90, declined to a low of ₹186.14, and traded at ₹187.33, down 6.72% from the previous close of ₹200.82. The decline reflected post-results profit booking as market participants assessed the company's latest financial performance.
Fundamental View
For the quarter ended June 30, 2026, Pace Digitek (NSE: PACEDIGITK) reported standalone total income of ₹28,313.10 million. Profit before tax stood at ₹5,724.30 million, while net profit was ₹4,251.40 million. Earnings per share came in at ₹1.97. The quarterly performance reflected continued profitability and operational execution. Going forward, investors may monitor order inflows, project execution, operating margins, working capital management, and future quarterly earnings to assess business performance.
Technical View
The daily chart indicates that Pace Digitek (NSE: PACEDIGITK) witnessed a corrective move after trading near recent highs. The stock has slipped below its 50-day simple moving average of approximately ₹197.92, indicating weaker short-term momentum. The 14-day RSI has eased to around 38.85, suggesting momentum has moderated following the recent decline. Increased trading activity during the session reflected active participation as the stock underwent post-results profit booking. The stock's ability to reclaim the 50-day SMA will remain an important technical factor in the coming sessions.
Key Technical Levels
Immediate support is placed near ₹186.14, followed by the ₹180.00 zone. Immediate resistance is seen around ₹193.90, while the next resistance is near the 50-day simple moving average at ₹197.92. A sustained move above these levels could improve the prevailing technical structure.
Risks to Watch
- Volatility following the post-results correction.
- Execution of ongoing infrastructure projects.
- Pressure on operating margins due to rising costs.
- Order inflow and revenue visibility in upcoming quarters.
- Price movement around the 50-day SMA.
Summary
Pace Digitek (NSE: PACEDIGITK) declined more than 6% after reporting its June 2026 quarter results despite remaining profitable during the period. The company posted standalone total income of ₹28,313.10 million and net profit of ₹4,251.40 million. Technically, the stock has slipped below its 50-day SMA, while momentum indicators have softened after the correction. Investors may continue monitoring quarterly financial performance, project execution, margin trends, and whether the stock stabilizes around key technical levels.
FAQs
Q: Why did Pace Digitek (NSE: PACEDIGITK) shares decline today?
A: The stock fell 6.72% as investors booked profits after the June 2026 quarter results despite the company reporting healthy financial performance.
Q: What were Pace Digitek's June 2026 quarter financial results?
A: The company reported standalone total income of ₹28,313.10 million, profit before tax of ₹5,724.30 million, net profit of ₹4,251.40 million, and earnings per share of ₹1.97.
Q: What were the key trading levels for Pace Digitek (NSE: PACEDIGITK) today?
A: The stock opened at ₹191.50, touched an intraday high of ₹193.90, a low of ₹186.14, and traded around ₹187.33 during the session.
Q: What does the technical chart indicate for Pace Digitek (NSE: PACEDIGITK)?
A: The stock has moved below its 50-day SMA after the recent correction, while the RSI near 38.85 indicates weakening short-term momentum.
Q: What should investors monitor going forward?
A: Investors may watch future quarterly earnings, order inflows, project execution, operating margins, and whether the stock regains levels above its 50-day SMA.