
Highlights
- Petronet LNG shares declined 3.82%, trading below its 50-day moving average.
- The stock is currently around ₹ 260.50 after breaking key support levels.
- RSI at 35.28 indicates weakening momentum near lower technical range.
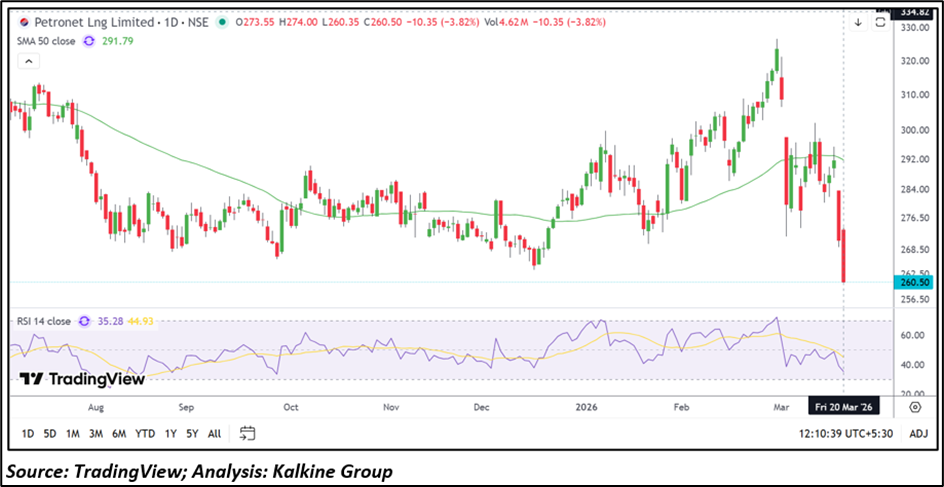
Petronet LNG Limited (NSE:PETRONET) is trading around ₹ 260.50, down approximately 3.82% as of March 20, 2026. The stock is trading below its 50-day simple moving average near ₹ 291.79, which now acts as a key resistance level. The price structure reflects a breakdown below an important support zone, indicating a continuation of the broader downtrend.
Sector Context and Industry Trends
Petronet LNG operates in the natural gas and energy infrastructure sector, which is influenced by global LNG prices, demand for cleaner fuels, and domestic energy consumption. The sector plays a key role in India’s energy transition, with increasing focus on reducing carbon emissions. Demand trends, import dynamics, and pricing mechanisms significantly impact companies operating in LNG transportation and regasification.
Financial Overview
No specific financial figures are provided in the latest update. However, companies in the LNG segment typically generate revenue through regasification charges, long-term contracts, and capacity utilization. Financial performance is closely linked to gas demand, pricing spreads, and infrastructure utilization levels.
Volume and Trading Activity
The recent decline has been accompanied by trading activity that reflects selling pressure after the breakdown of key technical levels. Increased activity during a downtrend can indicate distribution, although sustained trends will depend on further price confirmation and volume behaviour.
Technical Analysis
Petronet LNG (NSE:PETRONET) is trading around ₹260.50, down 3.82% as of March 20, 2026, and is trading below its 50-day SMA near ₹291.79, which continues to act as a key resistance level. The price structure reflects a breakdown below an important support zone, indicating a continuation of the broader downtrend.
Momentum has weakened, with the RSI at 35.28, approaching the lower range. Immediate support is placed near ₹245.00 and ₹230.00, while resistance is seen near ₹275.00 and ₹292.00, where price may face near-term hurdles on any pullback.
Outlook Considerations
The breakdown below a key support level suggests continued weakness in the near term. The stock will need to reclaim key moving averages to stabilize momentum. Market participants may track LNG demand, pricing trends, and overall energy sector developments to assess future direction.
Risk Factors
- Continued weakness if price fails to reclaim key resistance levels
- Exposure to volatility in global LNG prices and demand
- Dependence on capacity utilization and long-term contracts
- Risk of further downside if support levels are breached
Conclusion
Petronet LNG Ltd is trading lower after breaking below key support levels and remains below its 50-day moving average. The stock reflects a continuation of the broader downtrend, with weak momentum and defined support and resistance levels likely to influence its near-term movement. Future direction will depend on whether support holds or further declines occur.
Petronet LNG shares declined 3.82% to ₹ 260.50, breaking below key support and trading under the 50-day SMA near ₹ 291.79. The stock shows continued downtrend with RSI at 35.28, indicating weak momentum. Support is placed near ₹ 245 and ₹ 230, while resistance levels are seen around ₹ 275 and ₹ 292 on any recovery.
FAQs
- Why did Petronet LNG stock decline recently?
The stock declined due to a breakdown below key support levels and continuation of a broader downtrend. - What are the key technical levels for Petronet LNG?
Support is near ₹ 245 and ₹ 230, while resistance levels are placed at ₹ 275 and ₹ 292. - What does the RSI indicate for this stock?
The RSI at 35.28 indicates weakening momentum and movement toward oversold territory.