

Highlights
- Raj TV shares declined nearly 10% and slipped to fresh trading lows.
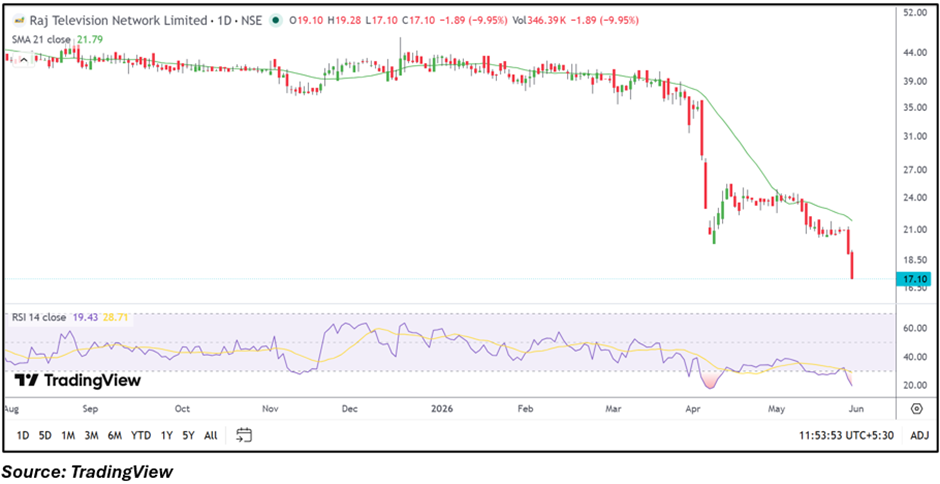
- Stock continues to trade below its 21-day SMA, indicating a weak trend.
- RSI has entered oversold territory, highlighting persistent selling pressure.
Overview
Raj Television Network Limited (NSE: RAJTV) remained under significant pressure on May 29, with the stock falling 9.95% to INR 17.10. The decline pushed the stock to fresh lows as sellers continued to dominate trading activity.
The stock opened at INR 19.10 and touched an intraday low of INR 17.10, reflecting broad weakness across the counter. Despite reporting a profitable March 2026 quarter, the stock has witnessed sustained selling pressure in recent sessions.
Fundamental View
For the quarter ended March 2026, Raj Television Network reported standalone total income of INR 2,181.33 lakh. The company posted a profit before tax of INR 32.30 lakh and a net profit of INR 22.02 lakh. Earnings per share stood at INR 0.04.
While the company remained profitable during the quarter, the stock's recent price action suggests that traders are currently focusing more on technical weakness than on quarterly earnings performance.
Technical View
RAJTV is trading at INR 17.10, well below its 21-day SMA of INR 21.79, reflecting a clearly weak near-term structure. Price action indicates continued lower highs and lower lows, with the stock failing to attract sustained support after previous declines.
The latest breakdown below recent consolidation levels suggests that bearish momentum remains dominant. Unless the stock reclaims key resistance zones, the technical setup may continue to favor sellers.
Momentum Indicator
The 14-day RSI stands at 19.43, which is firmly inside oversold territory. Such readings indicate aggressive selling pressure over recent sessions. While oversold conditions can sometimes trigger short-term pullbacks, they do not automatically signal a trend reversal.
Key Technical Levels
At the current market price of INR 17.10, immediate support is placed near INR 16.25, while the next important support level is around INR 15.40. On the upside, initial resistance is seen near INR 17.95, followed by a stronger hurdle around INR 18.80. A move above these resistance zones may help stabilize the short-term structure, while sustained trading below support could keep pressure on the stock.
Risks to Watch
- Persistent trading below the 21-day SMA.
- Extremely weak RSI momentum readings.
- Low trading participation may increase volatility.
- Failure to hold nearby support levels.
Summary
Raj TV shares have extended their decline, falling nearly 10% and moving deeper into a weak technical zone. Although the company reported a profitable March quarter, market sentiment remains focused on the deteriorating price structure. The stock trades below its 21-day SMA, while RSI has slipped into oversold territory. Support levels near INR 16.25 and INR 15.40 remain important, while resistance is placed at INR 17.95 and INR 18.80.
FAQs
- Why did Raj TV shares fall nearly 10%?
The decline appears driven by continued technical weakness and sustained selling pressure despite the company's profitable quarter.
- Is Raj TV stock oversold?
Yes. The 14-day RSI of 19.43 indicates the stock is currently trading in oversold territory.
- What levels should traders watch?
Key support levels are INR 16.25 and INR 15.40, while resistance is seen near INR 17.95 and INR 18.80.