
Highlights
- Ravindra Energy shares surged 18.73% and emerged among the top gainers.
- The stock broke above its recent consolidation range with strong momentum.
- RSI moved into bullish territory, indicating improving price strength.
Overview
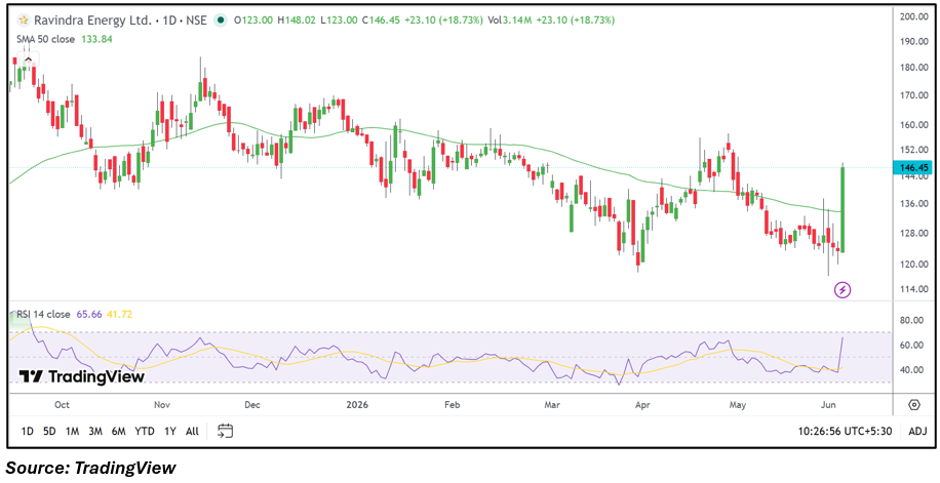
Ravindra Energy (NSE: RELTD) witnessed a sharp rally on June 4, with the stock climbing 18.73% to ₹146.45. The move came after weeks of range-bound trading and pushed the stock to its highest level in several sessions. The strong upside momentum has improved the technical structure and placed the stock on traders' radar as it attempts to build on the breakout.
Fundamental View
For the quarter ended March 2026, Ravindra Energy reported consolidated total income of INR 13,794.60 lakh. Profit before tax stood at INR 1,789.10 lakh, while net profit came in at INR 1,261.80 lakh. Earnings per share were reported at INR 0.71.
The company remained profitable during the quarter, and the latest earnings performance provided a supportive backdrop for the stock's recent recovery.
Technical View
Ravindra Energy is trading at ₹146.45, comfortably above its 50-day SMA of ₹119.94, reflecting a significant improvement in the near-term technical structure. Recent price action shows the stock breaking out of a prolonged consolidation range and registering a strong bullish candle.
The 14-day RSI has climbed to 68.85, indicating strengthening momentum. While the indicator is approaching overbought territory, it continues to suggest that bullish momentum remains intact.
Momentum Indicator
The RSI has moved well above the neutral 50 mark and is trending higher. This reflects improving momentum and suggests the stock has regained strength after spending several weeks in a consolidation phase.
Key Technical Levels
The immediate support level is placed near ₹139.13. If the stock experiences profit booking, the next support zone is located around ₹131.81.
On the upside, the first resistance is seen near ₹153.77. A sustained move above this level could bring the next resistance area around ₹161.10 into focus.
Risks to Watch
- Profit booking after the sharp one-day rally.
- RSI approaching overbought territory.
- Failure to sustain above the breakout zone.
- Broader market volatility affecting sentiment.
Summary
Ravindra Energy delivered a strong breakout after gaining nearly 19% and moving decisively above its 50-day SMA. The latest quarterly results showed profitability, while technical indicators point to improving momentum. The stock has emerged from consolidation, and traders will closely watch whether it can hold above support levels and extend gains toward the next resistance zones.
FAQs
- Why did Ravindra Energy shares rise sharply today?
The stock rallied after breaking out of a consolidation range and showing improved technical momentum.
- Is Ravindra Energy trading above its key moving average?
Yes, the stock is trading above its 50-day SMA, indicating an improved trend structure.
- What levels should traders monitor?
Support is seen near ₹139.13 and ₹131.81, while resistance is located near ₹153.77 and ₹161.10.