
- Stock surges to ₹553.95, up 16.69% in the session
• Q4 net profit rises to ₹16,112.00 lakh on strong revenue growth
• Sharp breakout above 50-day SMA boosts momentum outlook
Overview
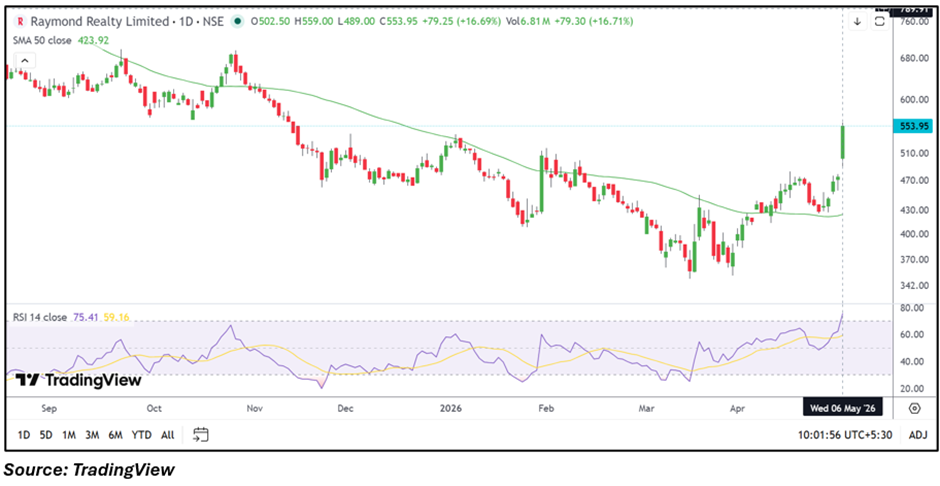
Raymond Realty Ltd (NSE: RAYMONDREL) is trading near ₹553.95, gaining 16.69% in the session after strong quarterly numbers and renewed buying activity in the real estate space. The sharp rally pushed the stock to a fresh multi-month high, with price action reflecting improved sentiment following the company’s latest earnings update.
The stock opened at ₹502.50 and touched an intraday high of ₹559.00, while volumes also remained elevated during the session. The move comes as broader interest in select realty counters continues to improve amid expectations of sustained housing demand and project execution momentum.
Fundamental View
For the quarter ended March 2026, Raymond Realty Ltd reported consolidated total income of ₹1,17,580.00 lakh. Profit before tax stood at ₹20,587.00 lakh, while net profit came in at ₹16,112.00 lakh. Earnings per share for the quarter was reported at ₹23.97.
The latest quarterly performance reflected healthy operational momentum, with profitability improving significantly. Market participants appear to be reacting positively to the earnings growth, especially as investors continue to track execution trends and demand conditions across the premium and mid-income residential segments.
The company’s strong quarterly update has also improved sentiment around its near-term growth visibility, particularly after the stock had already shown steady recovery in recent weeks.
Technical View
Technically, Raymond Realty Ltd has witnessed a decisive breakout move after reclaiming higher levels above its 50-day SMA near ₹423.92. The stock had been forming a gradual recovery structure over the past several weeks before accelerating sharply in the current session.
Price action now reflects strong upward momentum, supported by a wide bullish candle and strong volume participation. The 14-day RSI has climbed near 75.41, indicating elevated momentum conditions after the sharp rally.
While the trend structure remains positive, the sharp rise in a single session may also lead to short-term volatility or consolidation near higher levels.
Key Technical Levels
Immediate support is placed around ₹510.00–₹480.00, which could act as an important cushion on any pullback. On the upside, resistance is seen near ₹600.00–₹645.00, where the next phase of the rally could face supply pressure.
Risks
- Elevated RSI indicating stretched near-term momentum
• Possibility of volatility after sharp one-day rally
• Realty sector remains sensitive to interest-rate trends
• Profit booking at higher levels may limit immediate upside
Summary
Raymond Realty Ltd (NSE: RAYMONDREL) has staged a strong breakout after reporting robust March quarter earnings, with the stock rallying nearly 17% in the session. Improved profitability, stronger sentiment in real estate counters, and bullish technical structure have supported the sharp move.
Going ahead, investors are likely to monitor whether the stock can sustain above breakout levels and maintain momentum after the recent surge.
FAQs
Why is RAYMONDREL share price rising today?
The stock surged after reporting strong March 2026 quarterly earnings and improved profitability.
What was Raymond Realty’s Q4 net profit?
The company reported net profit of ₹16,112.00 lakh for the March 2026 quarter.
What are the key technical levels for RAYMONDREL?
Support is placed near ₹510.00–₹480.00, while resistance is seen around ₹600.00–₹645.00.