
Highlights
- Rubicon Research shares surged over 13% and emerged among the top gainers.
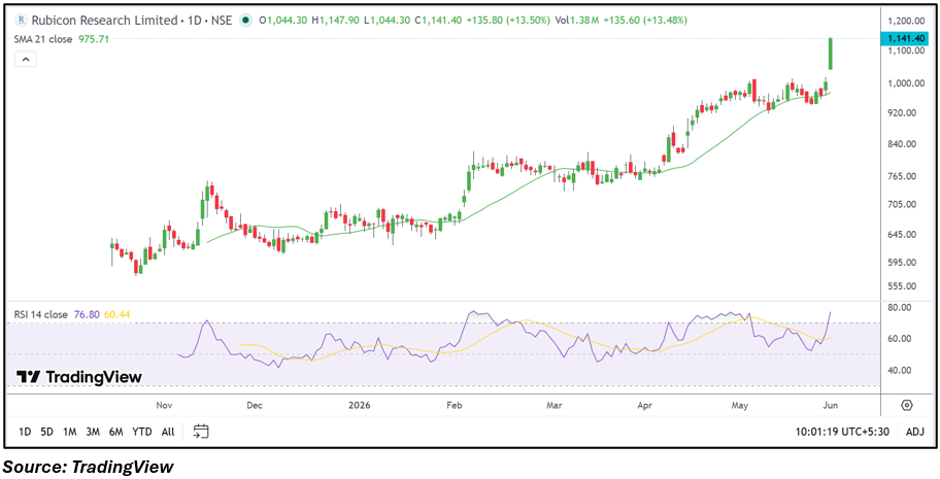
- The stock climbed to fresh highs while remaining well above its 21-day SMA.
- RSI moved into elevated territory, reflecting strong momentum conditions.
Overview
Rubicon Research Limited (NSE: RUBICON) witnessed a sharp rally on June 1, with the stock rising more than 13% during the session. The move pushed the stock to fresh highs and extended the ongoing uptrend that has been developing over the past several months. Strong price action and increased trading activity helped the stock attract market attention.
Fundamental View
For the quarter ended March 2026, Rubicon Research reported consolidated total income of INR 51,652.50 lakh. Profit before tax stood at INR 9,868.70 lakh, while net profit came in at INR 7,678.50 lakh. Earnings per share for the quarter was reported at INR 4.66.
The results were announced on May 29, 2026. The latest financial performance reflected profitability and revenue generation, which coincided with the stock's strong market reaction.
Technical View
Rubicon Research traded near INR 1,142.80 and remained comfortably above its 21-day SMA of INR 975.71, reflecting a positive near-term structure. Recent price action indicates a continuation breakout, with the stock moving beyond its previous consolidation zone and reaching fresh highs. The rally has been accompanied by strong momentum, highlighting continued market interest in the counter. As long as the stock sustains above the breakout region, the broader uptrend remains intact.
Momentum Indicator
The 14-day RSI climbed to 76.80, moving into elevated territory and reflecting strong momentum conditions. While the reading highlights the strength of the current rally, it also suggests that short-term volatility may increase after the sharp advance.
Key Technical Levels
At the current market price of INR 1,142.80, immediate support is placed near INR 1,085.66, while the next support zone is around INR 1,028.52. On the upside, immediate resistance is seen near INR 1,199.94, followed by a higher resistance level around INR 1,257.08. These levels may be closely watched as the stock trades near fresh highs.
Risks to Watch
- Elevated RSI may lead to short-term volatility.
- Profit-booking after a sharp rally could emerge.
- Rich valuations may increase price sensitivity.
- Broader market weakness could affect sentiment.
Summary
Rubicon Research extended its ongoing uptrend with a strong double-digit gain following its latest quarterly results. The stock is trading at fresh highs, well above its key moving average, while momentum indicators remain elevated. The latest earnings update, combined with the breakout in price action, has strengthened the near-term technical setup. Going forward, investors may monitor whether the stock can sustain above its breakout zone and maintain earnings momentum.
FAQs
- Why did Rubicon Research shares rally sharply?
The stock gained after the company reported its latest quarterly results and continued its ongoing upward trend.
- What is the immediate support level for Rubicon Research?
The first support level is near INR 1,085.66, followed by a stronger support zone around INR 1,028.52.
- What does the RSI indicate for the stock?
The RSI of 76.80 reflects strong momentum conditions, though it may also signal increased short-term volatility.