

Highlights
- Sandesh shares hit the 20% upper circuit following the announcement of June quarter results.
- Standalone net profit rose to ₹9,982.87 lakh during the quarter.
- Total income for the quarter stood at ₹54,990.52 lakh.
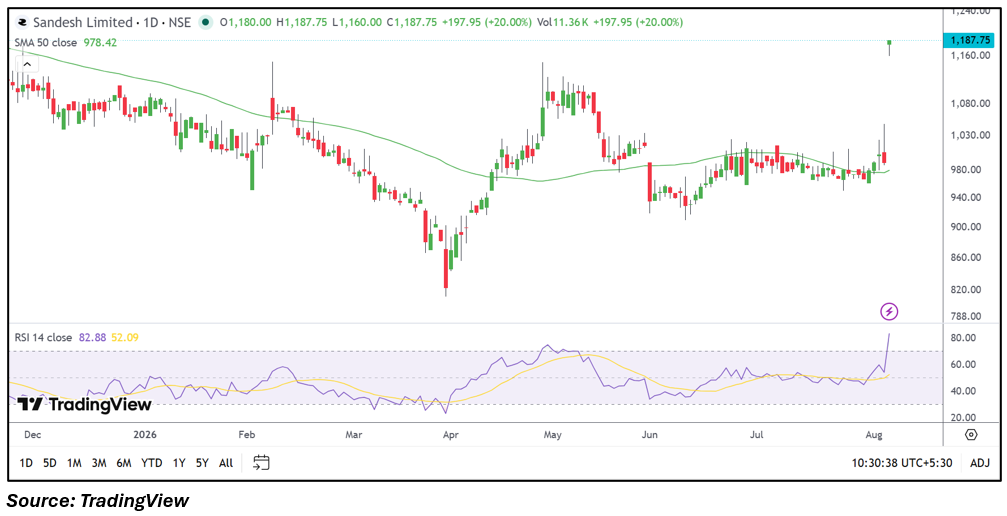
- The stock touched an intraday high of ₹1,187.75 after opening at ₹1,180.00.
- Price traded well above its 50-day moving average, reflecting improved market momentum.
- Investors will monitor whether the stock sustains the breakout in the coming sessions.
Overview
The Sandesh Limited (NSE: SANDESH), a diversified media company engaged in newspaper publishing, television broadcasting and digital media operations, witnessed strong buying interest after reporting its June 2026 quarterly earnings. The stock hit the 20% upper circuit at ₹1,187.75 after opening at ₹1,180.00, reflecting a positive market reaction to the company's latest financial performance.
Fundamental View
For the quarter ended June 2026, Sandesh reported standalone total income of ₹54,990.52 lakh. Profit before tax came in at ₹11,037.92 lakh, while net profit stood at ₹9,982.87 lakh. Earnings per share for the quarter was ₹131.88. The latest financial performance reflected healthy profitability during the quarter. Going forward, investors may monitor advertising revenue trends, circulation growth, digital business expansion and future quarterly earnings.
Technical View
The stock registered a decisive breakout and locked at the 20% upper circuit, supported by strong trading momentum. Price remained comfortably above its 50-day moving average of ₹978.42, indicating an improving medium-term technical structure. The 14-day RSI stood at 82.88, reflecting elevated momentum after the sharp rally. Sustained trading above recent breakout levels could remain an important factor to watch over the coming sessions.
Key Technical Levels
Immediate support is placed near ₹1,160.00, followed by ₹1,080.00. On the upside, immediate resistance is seen around ₹1,187.75, while the next resistance is placed near ₹1,240.00 if the upward momentum continues.
Risks to Watch
- Advertising demand fluctuations.
- Slowdown in print media revenues.
- Rising operating costs.
- Competitive pressure from digital platforms.
- Overall market volatility.
Summary
Sandesh delivered a strong June quarter with healthy revenue and profitability, prompting a sharp positive reaction from the market. The stock's move to the upper circuit reflects renewed momentum, while its position above the 50-day moving average indicates an improved technical setup. Investors are likely to monitor whether the earnings-driven rally sustains over the coming sessions.
FAQs
Q: Why did Sandesh shares hit the 20% upper circuit?
A: The stock rallied after the company reported strong June quarter financial results, including healthy revenue and profit growth.
Q: What was Sandesh's total income in the June quarter?
A: The company reported standalone total income of ₹54,990.52 lakh.
Q: How much net profit did Sandesh report?
A: Sandesh reported standalone net profit of ₹9,982.87 lakh for the June 2026 quarter.
Q: Is the stock trading above its 50-day moving average?
A: Yes, the stock is trading well above its 50-day moving average of ₹978.42.
Q: What should investors monitor going forward?
A: Investors may track future quarterly earnings, advertising revenue trends, digital business growth and the stock's movement around key technical levels.