

Highlights
- Savita Oil Technologies shares surged more than 18% after announcing strong June quarter results.
- Consolidated net profit stood at ₹28,805.50 lakh during the quarter.
- Total income increased to ₹1,51,267.08 lakh.
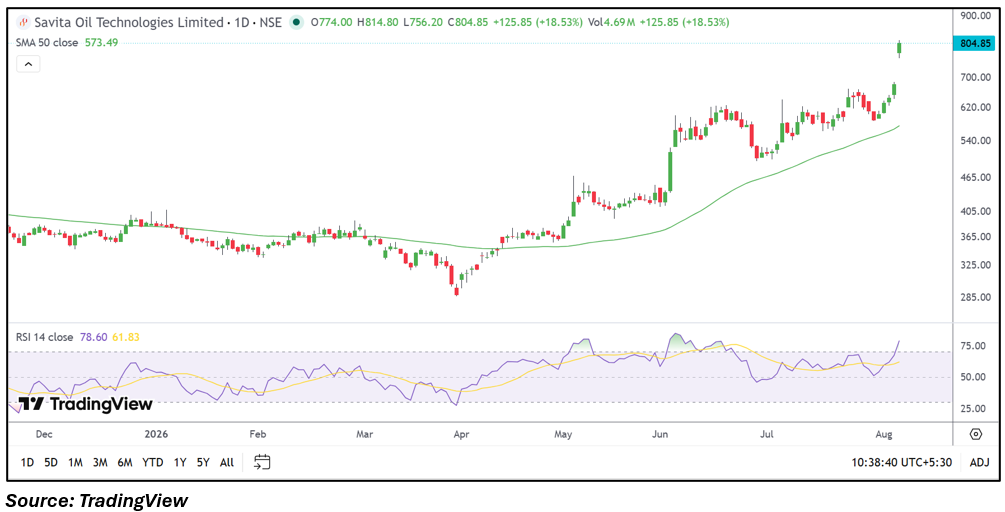
- The stock touched an intraday high of ₹814.80 after opening at ₹774.00.
- Price traded well above the 50-day moving average with strong momentum.
- Investors will monitor whether the earnings-led breakout sustains in the coming sessions.
Overview
Savita Oil Technologies Limited (NSE: SOTL), a leading manufacturer of transformer oils, lubricants and specialty petroleum products, witnessed a sharp rally after reporting its June 2026 quarterly results. The stock climbed more than 18% to around ₹804.00 after touching an intraday high of ₹814.80, reflecting a positive market reaction to the company's latest earnings performance.
Fundamental View
For the quarter ended June 2026, Savita Oil Technologies reported consolidated total income of ₹1,51,267.08 lakh. Profit before tax came in at ₹38,659.81 lakh, while net profit stood at ₹28,805.50 lakh. Earnings per share for the quarter was ₹42.01. The latest results reflected healthy profitability and operational performance during the quarter. Investors may continue tracking demand across lubricant and specialty oil segments, raw material prices, export performance and future quarterly earnings.
Technical View
The stock registered a strong breakout supported by robust volumes after the quarterly results. Price remained comfortably above its 50-day moving average of ₹573.49, indicating a positive medium-term technical structure. The 14-day RSI stood at 78.60, reflecting strong momentum following the sharp rally. The price has also moved to a fresh short-term high, suggesting increased market participation after the earnings announcement.
Key Technical Levels
Immediate support is placed near ₹756.20, followed by ₹700.00. On the upside, immediate resistance is seen around ₹814.80, while the next resistance is positioned near ₹850.00. Price action around these levels may provide direction over the coming sessions.
Risks to Watch
- Volatility in crude oil prices.
- Fluctuations in raw material costs.
- Demand trends across industrial and automotive sectors.
- Export market uncertainty.
- Broad market volatility.
Summary
Savita Oil Technologies reported a strong June quarter, supported by healthy revenue and profitability, which was followed by a sharp rise in its share price. The stock is trading well above its medium-term moving average after the earnings-driven breakout. Investors are likely to monitor whether the momentum sustains, along with future earnings performance and developments in input costs and demand conditions.
FAQs
Q: Why did Savita Oil Technologies shares rise more than 18%?
A: The stock rallied after the company reported strong June quarter earnings with robust revenue and profit growth.
Q: What was Savita Oil Technologies' total income in the June quarter?
A: The company reported consolidated total income of ₹1,51,267.08 lakh.
Q: How much net profit did Savita Oil Technologies report?
A: The company reported consolidated net profit of ₹28,805.50 lakh for the June 2026 quarter.
Q: Is the stock trading above its 50-day moving average?
A: Yes, the stock is trading well above its 50-day moving average of ₹573.49.
Q: What should investors monitor going forward?
A: Investors may track future quarterly earnings, crude oil price movements, demand trends, margin performance and the stock's movement around key technical levels.