

Highlights
- Shekhawati Industries Limited (NSE: SHEKHAWATI) shares declined 4.95% during Friday's trading session.
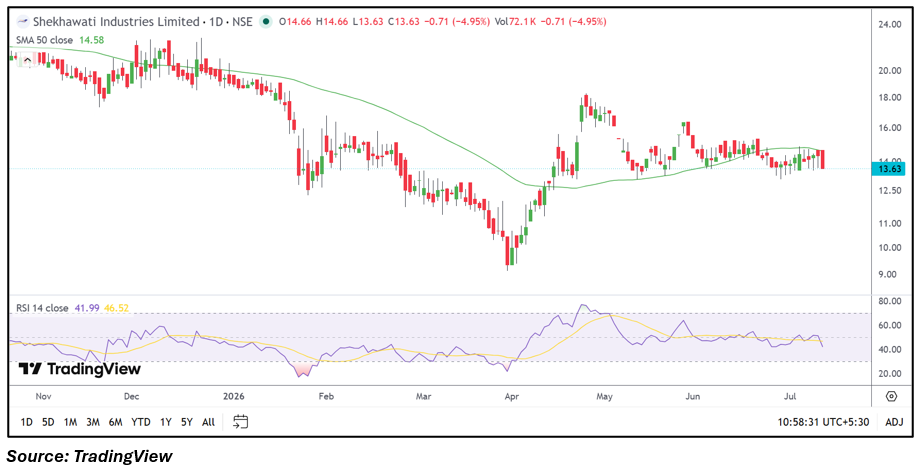
- The stock slipped to ₹13.63 after opening at ₹14.66 and touching an intraday low of ₹13.63.
- The company reported standalone net profit of ₹463.24 lakh for the quarter ended March 2026.
- The stock is trading below its 50-day Simple Moving Average, reflecting a cautious technical setup.
- The 14-day RSI remained around 42, indicating subdued momentum.
- Investors are monitoring earnings sustainability and price action for fresh directional cues.
Overview
Shekhawati Industries Limited (NSE: SHEKHAWATI) operates in the textile sector with a focus on manufacturing polyester textured yarn and related products. The stock remained under pressure during Friday's trading session, falling 4.95% to ₹13.63 after opening at ₹14.66. Despite reporting profitability in its latest quarterly results, the stock witnessed weakness as broader market sentiment and soft technical indicators continued to influence trading activity.
Fundamental View
Shekhawati Industries Limited (NSE: SHEKHAWATI) reported standalone total income of ₹900.36 lakh for the quarter ended March 2026. The company posted a profit before tax of ₹463.24 lakh and a net profit of ₹463.24 lakh, while earnings per share (EPS) stood at ₹1.34. The latest quarterly performance reflects an improvement in profitability compared with earlier periods. However, investors are likely to monitor whether the company can sustain earnings growth and improve operating performance in the coming quarters.
Technical View
Shekhawati Industries Limited (NSE: SHEKHAWATI) is trading below its 50-day Simple Moving Average of approximately ₹14.58, indicating that the near-term trend remains weak. The stock has been consolidating after recent volatility, while the 14-day Relative Strength Index (RSI) hovered near 42, suggesting softer momentum without entering oversold territory. Price action indicates that market participants remain cautious as the stock trades close to short-term support levels.
Key Technical Levels
For Shekhawati Industries Limited (NSE: SHEKHAWATI), immediate support is placed near ₹13.50, followed by the next support around ₹13.00. On the upside, immediate resistance is seen near ₹14.20, while the next resistance is positioned around ₹14.80. A sustained move beyond these levels could influence the stock's near-term direction.
Risks to Watch
- Fluctuations in raw material prices.
- Demand slowdown in the textile sector.
- Margin pressure from rising operating costs.
- Liquidity concerns due to lower trading volumes.
- Broader market volatility impacting small-cap stocks.
Summary
Shekhawati Industries Limited (NSE: SHEKHAWATI) extended its weakness despite reporting a profitable March 2026 quarter. The stock remains below its key moving average, while technical indicators suggest subdued momentum. Going forward, investors are likely to track earnings consistency, demand conditions in the textile industry, and price action around key technical levels to assess the stock's next move.
FAQs
Q: Why did Shekhawati Industries Limited (NSE: SHEKHAWATI) shares fall nearly 5% today?
A: The decline was largely driven by weak technical momentum and cautious market sentiment despite the company's latest profitable quarterly results.
Q: What were the latest quarterly results of Shekhawati Industries Limited (NSE: SHEKHAWATI)?
A: The company reported standalone total income of ₹900.36 lakh and a net profit of ₹463.24 lakh for the quarter ended March 2026.
Q: What is the current technical outlook for Shekhawati Industries Limited (NSE: SHEKHAWATI)?
A: The stock is trading below its 50-day Simple Moving Average, while the RSI around 42 indicates subdued momentum.
Q: What are the important technical levels for Shekhawati Industries Limited (NSE: SHEKHAWATI)?
A: Immediate support is around ₹13.50 and ₹13.00, while resistance is placed near ₹14.20 and ₹14.80.
Q: What should investors monitor going forward in Shekhawati Industries Limited (NSE: SHEKHAWATI)?
A: Investors should monitor quarterly earnings, demand trends, raw material costs, overall business performance, and price action around key technical levels.