
Highlights
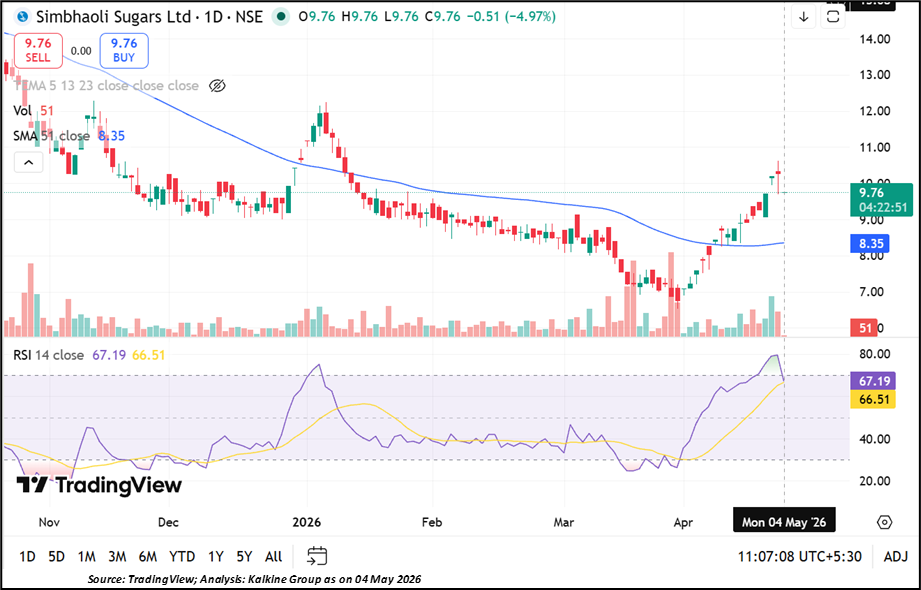
- The stock fell nearly 5% and is trading near ₹9.76 level.
- RSI near 67 shows moderate strength but close to overbought zone.
- Price remains above 51-day SMA, indicating some support.
Shares of Simbhaoli Sugars (NSE:SIMBHALS) saw a decline in the latest session. The stock fell around 4.97% to ₹9.76, compared to the previous close of ₹10.27. It opened at ₹9.76 and remained at the same level throughout the session, indicating limited trading activity.
The stock touched both its high and low at ₹9.76, suggesting no price movement during the session. The price band was narrow, with ₹10.78 as the upper limit and ₹9.76 as the lower limit.
Returns Show Weak Long-Term Trend
The stock has shown mixed performance across time periods. In one week, it declined 4.97%, while the NIFTY 50 gained 0.51%.
In one month, it rose 35.18%, outperforming the index gain of 6.61%. However, year-to-date returns are negative at -12.62%, and one-year returns stand at -28.76%. Over three years, the stock declined 61.19%, showing weak long-term performance.
Low Liquidity and Limited Activity
Trading activity in the stock remains very low, with no significant volume recorded in the latest session. The impact cost is high at 4.81, which suggests large price changes can happen even with small trades.
The company has a total market cap of ₹40.29 crore and a free float market cap of ₹18.80 crore, indicating a microcap stock with limited participation.
Key Risks to Monitor
- Very low liquidity can make buying or selling difficult.
- High impact cost can cause sharp price changes.
- Weak long-term returns show lack of consistent performance.
- Narrow price band limits daily movement and flexibility.
Technical Summary
Simbhaoli Sugars (NSE:SIMBHALS) is trading near ₹9.76, down around 4.97%, and remains above its 51-day SMA near ₹8.35, RSI near 67.19. Immediate support is placed in the ₹8.00–₹8.50 zone, while resistance is seen near the ₹10.50–₹12.00 range.
Summary
Simbhaoli Sugars (NSE:SIMBHALS) stock fell about 5% to ₹9.76 and showed no intraday movement. The stock remains above its 51-day SMA, offering some support, while RSI indicates moderate strength. Short-term performance is positive, but long-term returns remain weak. Low liquidity and high impact cost are key concerns. Support is near ₹8–₹8.50, resistance near ₹10.50–₹12.
FAQs
- Why did Simbhaoli Sugars stock fall today?
The stock declined due to selling pressure and low trading activity, leading it to trade at its lower price band. - Is the stock still in an uptrend?
The stock is above its 51-day average, showing some support, but overall trend remains mixed due to weak long-term returns. - What levels should investors watch?
Support is between ₹8 and ₹8.50, while resistance is expected in the ₹10.50 to ₹12 range.