

Highlights
- Singer India shares advanced 19.99% on August 12, 2026, placing the stock among the notable movers in the session.
- The latest available audited results showed total income of ₹16,855.00 lakh, profit before tax of ₹804.00 lakh and net profit of ₹590.00 lakh.
- The stock opened at ₹76.00 and moved to a high of ₹91.30, while the day's low was ₹73.68.
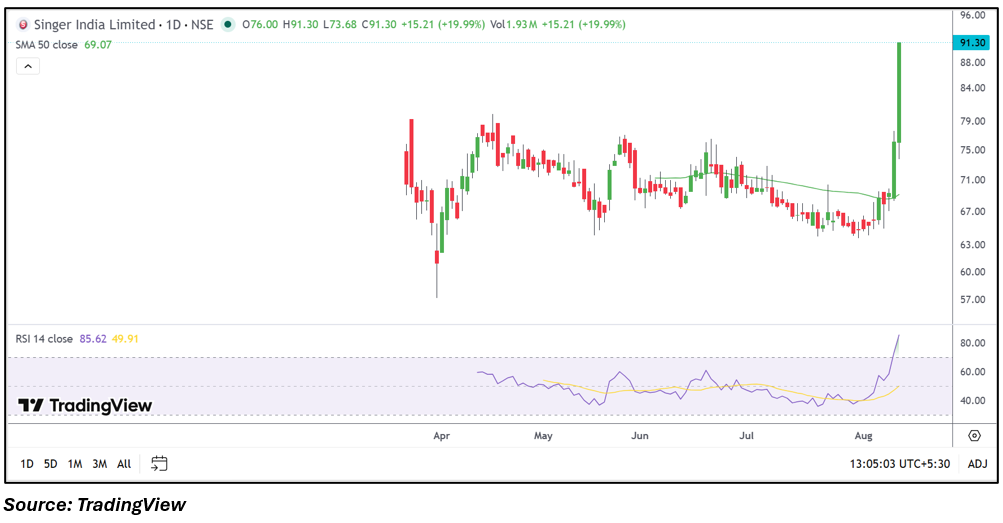
- The price moved well above its 50-day SMA of ₹69.07, marking a significant change in the recent price structure.
- Trading volume reached approximately 1.93 million shares, while VWAP stood at ₹85.05.
- Investors should monitor whether the recent price expansion is sustained, along with earnings, volumes and upcoming business developments.
Overview
Singer India (NSE: SINGERIND) is engaged in the sewing machine and related consumer products business in India. The stock gained 19.99% on August 12, 2026, rising from the previous close of ₹76.09 to ₹91.30. It opened at ₹76.00 and touched a high of ₹91.30, while the low stood at ₹73.68. VWAP was ₹85.05 and trading volume was approximately 1.93 million shares. The session represented a sharp move above the recent trading range, with the stock attracting substantial market participation and moving significantly above its 50-day average.
Fundamental View
The latest available audited standalone results for the quarter ended March 31, 2026, reported total income of ₹16,855.00 lakh, profit before tax of ₹804.00 lakh and net profit of ₹590.00 lakh. Earnings per share stood at ₹0.95. The financial figures provide the latest available reference for the company's profitability and operating performance. Future results will be important for assessing revenue growth, margins, profitability and the sustainability of earnings. Investors should also monitor demand for sewing machines and related products, consumer spending conditions, distribution performance and developments in the company's operating business.
Technical View
The daily chart shows a pronounced upward move, with the latest price of ₹91.30 substantially above the 50-day SMA of ₹69.07. The moving average had been relatively stable around the ₹68.00 to ₹70.00 region before the latest price expansion. RSI 14 has risen to 85.62, reflecting elevated short-term momentum following the sharp session advance. The stock also recorded a wide intraday range between ₹73.68 and ₹91.30, accompanied by volume of approximately 1.93 million shares. The price structure has moved above recent consolidation levels, while the elevated RSI indicates that momentum has accelerated considerably.
Key Technical Levels
Immediate support is around ₹85.05, corresponding to the session VWAP. Next support is near ₹76.00, around the opening level and previous trading zone. Immediate resistance is around ₹91.30, the latest session high. Next resistance is near ₹96.00, followed by the ₹100.00 region visible on the chart.
Risks to Watch
- RSI at 85.62 indicates an elevated short-term momentum reading.
- The wide intraday price range could result in increased near-term volatility.
- The stock has moved considerably above its 50-day SMA following the latest session.
- Future earnings will be important in determining whether the market move is supported by improving financial performance.
- Changes in consumer demand, operating margins and business conditions could affect future results.
Summary
Singer India (NSE: SINGERIND) recorded a sharp 19.99% advance, with the stock reaching ₹91.30 and moving substantially above its 50-day SMA of ₹69.07. The latest available audited results reported total income of ₹16,855.00 lakh, profit before tax of ₹804.00 lakh, net profit of ₹590.00 lakh and EPS of ₹0.95. Technically, the stock has moved above its recent trading range, while RSI at 85.62 reflects elevated momentum. Going forward, earnings performance, operating margins, trading volume, consumer demand and the sustainability of the latest price structure will remain important areas to monitor.
FAQs
Q: What happened to Singer India shares on August 12, 2026?
A: Singer India shares rose 19.99% during the session, reaching ₹91.30 from the previous close of ₹76.09.
Q: What were Singer India's latest available financial results?
A: The latest audited results reported total income of ₹16,855.00 lakh, profit before tax of ₹804.00 lakh and net profit of ₹590.00 lakh.
Q: What is Singer India's 50-day SMA?
A: The 50-day SMA shown on the chart is ₹69.07, which is below the latest market price of ₹91.30.
Q: What does the current RSI indicate for Singer India?
A: RSI 14 is at 85.62, indicating an elevated momentum reading following the latest sharp price movement.
Q: What should investors monitor in Singer India?
A: Investors should monitor upcoming financial results, operating margins, consumer demand, trading volumes and whether the recent change in price structure remains sustained.