
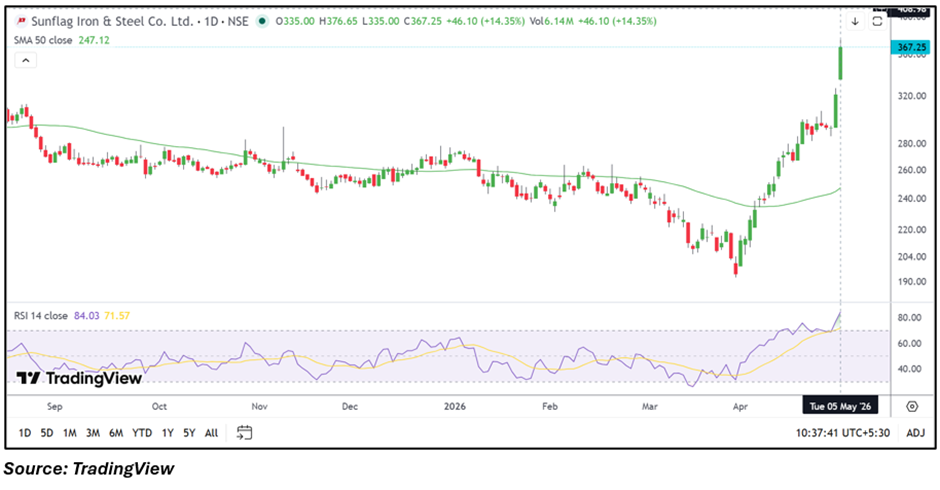
- Stock surges to ₹367.20, up 14.34% in the session
• Strong move extends rally after recent recovery phase
• Momentum spikes with RSI in elevated zone
Overview
Sunflag Iron & Steel Co Ltd (NSE: SUNFLAG) is trading near ₹367.20, gaining 14.34% in the latest session. The stock has witnessed a sharp upward move following a steady recovery from recent lows, with price action indicating a breakout above prior consolidation zones. The rally comes after a phase of sideways movement, suggesting that the stock has transitioned into a stronger near-term structure. The sharp price expansion also reflects improving sentiment in the counter, supported by sustained upward movement over the past few sessions.
Fundamental View
For the quarter ended December 2025, the company reported total income of ₹94,460.00 lakh. Profit before tax stood at ₹7,741.00 lakh, while net profit came in at ₹5,910.00 lakh, with earnings per share at ₹3.28.
The financial performance indicates stable operating trends, with the company maintaining profitability despite sector fluctuations. While there is no immediate new trigger from earnings, the broader metals segment and improving price realization trends may be indirectly supporting sentiment. However, the current rally appears to be influenced more by technical positioning and momentum rather than a sudden shift in fundamentals.
Technical View
Technically, SUNFLAG has moved well above its 50-day SMA near ₹247.12, indicating a strong improvement in short-term structure. The stock has formed a series of higher highs and higher lows, reflecting a clear upward trajectory. The recent session shows a strong bullish candle with expanded range, reinforcing the continuation of the trend.
The 14-day RSI near 84.03 has entered elevated territory, highlighting strong momentum. However, such levels also suggest that the stock is in a stretched zone, where short-term consolidation or mild pullback cannot be ruled out.
Key Technical Levels
Support is placed at ₹348.00–₹330.00, which may act as a cushion on any pullback. On the upside, resistance is seen at ₹390.00–₹410.00, where the next phase of the move could encounter some pressure.
Risks
- Elevated RSI indicating overextended momentum
• Possibility of near-term consolidation or pullback
• Absence of immediate fundamental triggers
• Volatility in metal sector trends
Summary
Sunflag Iron & Steel Co Ltd (NSE: SUNFLAG) has delivered a strong upside move, signaling continuation of its recovery trend and strengthening price structure. The breakout above consolidation zones reflects improved momentum and positioning. However, the sharp nature of the rally has pushed the stock into a stretched zone in the near term.
Going ahead, the sustainability of the move will depend on the stock’s ability to hold above key support levels and maintain structure during any consolidation phase. A pause or mild correction could help stabilize the trend before any further upside.
FAQs
Why did SUNFLAG stock rise sharply?
The move appears driven by technical breakout and momentum expansion following a recovery phase.
Is the stock overbought?
RSI is in the elevated zone, indicating stretched near-term momentum.
What levels should investors track?
Support near ₹348.00–₹330.00 and resistance around ₹390.00–₹410.00.