

Highlights
- TBZ shares surged over 16% after the company reported March quarter earnings.
- Net profit stood at INR 6,708.03 lakh, while total income reached INR 83,150.32 lakh.
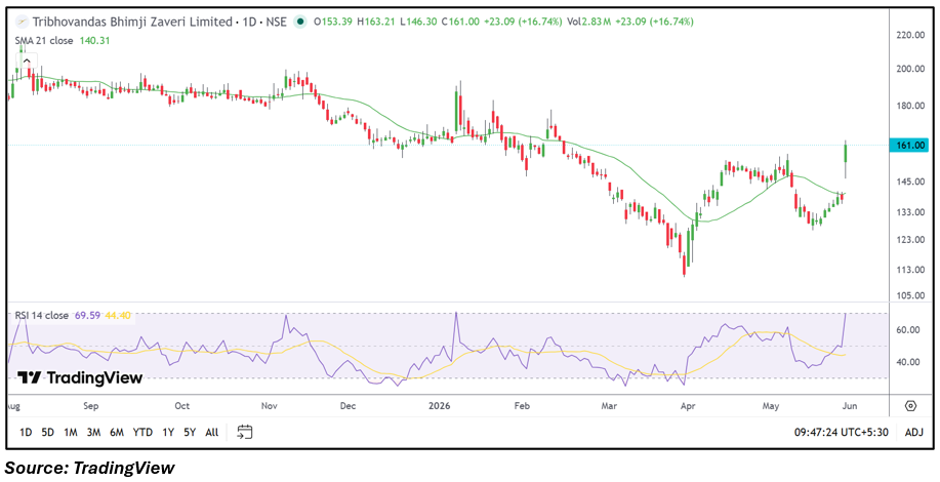
- The stock moved above its 21-day SMA with RSI approaching overbought territory.
Overview
Tribhovandas Bhimji Zaveri Limited (NSE: TBZ) emerged among the top gainers on May 29, 2026, with the stock climbing 16.74% to INR 161.00. The rally followed the company's latest quarterly earnings announcement and pushed the stock to a multi-week high.
The sharp move was accompanied by increased trading activity, indicating renewed market interest in the jewellery retailer after the March 2026 quarter results.
Fundamental View
For the quarter ended March 31, 2026, TBZ reported total income of INR 83,150.32 lakh. Profit before tax came in at INR 8,952.91 lakh, while net profit stood at INR 6,708.03 lakh. Earnings per share for the quarter were reported at INR 10.05.
The earnings announcement has drawn attention to the stock, with investors assessing whether the latest financial performance can support the ongoing momentum.
Technical View
TBZ is currently trading at INR 161.00, significantly above its 21-day SMA of INR 140.31, reflecting an improving near-term technical structure. The stock has broken above its recent consolidation range and registered a decisive upward move.
Price action indicates a bullish breakout from the recovery phase witnessed over the past several weeks. The sharp rise has also pushed the stock near a key resistance area that traders are likely to monitor closely.
Momentum Indicator
The 14-day RSI stands near 69.59, moving close to the overbought zone. The indicator reflects strong momentum conditions, although sustained gains may require the stock to absorb recent profit-booking attempts.
Key Technical Levels
TBZ's immediate support is placed near INR 152.95, while the next important downside cushion is around INR 144.90. On the upside, resistance is seen near INR 169.05, followed by a higher hurdle around INR 177.10. Sustaining above the first support zone may help maintain the current positive structure.
Risks to Watch
- Volatility may increase after the sharp one-day rally.
- Profit booking near resistance zones could emerge.
- Jewellery demand fluctuations may affect future earnings.
- Broader market weakness could impact momentum.
Summary
TBZ shares rallied sharply after the company's latest earnings announcement, helping the stock reach a multi-week high. The stock is trading above its 21-day SMA and momentum indicators remain favourable. However, with RSI approaching overbought territory and the stock nearing resistance levels, investors may closely watch whether the breakout sustains in the coming sessions.
FAQs
- Why did TBZ shares rise sharply?
TBZ shares gained after the company reported its March 2026 quarterly earnings and attracted strong market participation.
- What is the current technical outlook for TBZ?
The stock remains in a positive near-term structure, trading above its 21-day SMA after a breakout move.
- Which levels should investors monitor?
Key support levels are INR 152.95 and INR 144.90, while resistance is placed near INR 169.05 and INR 177.10.