
Highlights
- TCI Finance shares surged sharply and emerged among the top gainers.
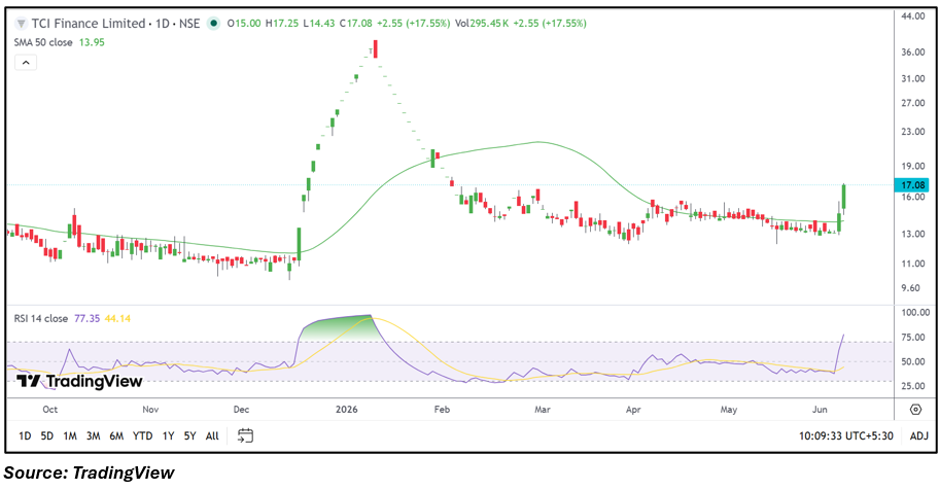
- The stock broke above its 50-day SMA and key consolidation zone.
- Momentum indicators moved into bullish territory following the breakout.
Overview
TCI Finance Limited (NSE: TCIFINANCE) gained 17.55% to ₹17.08 during trading on June 8, 2026, placing it among the top gainers on the NSE. The sharp move came after the stock broke out of a prolonged consolidation range and climbed above its 50-day Simple Moving Average (SMA) of ₹13.95. The rally was accompanied by increased trading activity, indicating renewed market interest in the counter.
Fundamental View
For the quarter ended March 2026, TCI Finance reported total income of ₹48.14 lakh and a profit before tax of ₹10.50 lakh. Net profit stood at ₹10.50 lakh, while earnings per share came in at ₹0.08. Although the company remained profitable during the reported quarter, investors may continue to monitor earnings consistency and business performance trends over the coming quarters.
Technical View
TCI Finance traded at ₹17.08, significantly above its 50-day SMA of ₹13.95, reflecting a positive near-term structure. The stock witnessed a decisive breakout from a narrow trading range that had persisted for several weeks. The 14-day RSI climbed to 77.35, indicating strong momentum following the sharp advance. While the trend remains positive, the elevated RSI level suggests the stock may experience short-term volatility after the recent surge.
Momentum Indicator
The RSI reading of 77.35 has moved into overbought territory, highlighting strong upward momentum. Sustained trading above the breakout zone could help maintain the positive structure, while profit booking after the sharp rise may lead to temporary consolidation.
Key Technical Levels
TCI Finance is currently trading near ₹17.08. Immediate support is placed around ₹16.23, followed by a stronger support zone near ₹15.37. On the upside, resistance is seen around ₹17.93, while a move above this level could open the path toward the next resistance zone near ₹18.79.
Risks to Watch
- Low liquidity may increase price volatility.
- Sharp rallies can trigger profit-booking pressure.
- Earnings visibility remains limited.
- Small-cap stocks may witness wider price swings.
Summary
TCI Finance emerged among the day's top gainers after breaking above a prolonged consolidation range and reclaiming its 50-day SMA. The sharp price move was supported by strong momentum, with RSI entering overbought territory. While the breakout improves the near-term technical outlook, traders may watch whether the stock can sustain above key support levels following the rapid advance.
FAQs
Why did TCI Finance shares rise today?
The stock surged after breaking above a consolidation range and moving decisively above its 50-day SMA.
What does the RSI indicate for TCI Finance?
The RSI of 77.35 reflects strong momentum but also suggests the stock is in overbought territory.
What are the key levels to watch?
Support levels are near ₹16.23 and ₹15.37, while resistance levels are around ₹17.93 and ₹18.79.