

Highlights
- TD Power Systems shares declined nearly 5% amid profit booking pressure.
- The stock remains above its 50-day SMA despite the recent correction.
- FY26 fourth-quarter earnings reflected continued profitability and revenue growth.
Overview
TD Power Systems (NSE: TDPOWERSYS) shares came under pressure on June 10, declining 4.67% to ₹1,173.50. The pullback follows a strong multi-month rally that lifted the stock to fresh highs in recent sessions. While the latest decline may reflect profit booking after the sharp advance, investors are closely watching whether the stock can maintain its broader upward trend.
Fundamental View
For the quarter ended March 2026, TD Power Systems reported consolidated total income of ₹59,727.45 lakh. Profit before tax stood at ₹9,870.19 lakh, while net profit came in at ₹7,219.11 lakh. Earnings per share were reported at ₹4.62, highlighting continued profitability and stable operational performance during the quarter.
Technical View
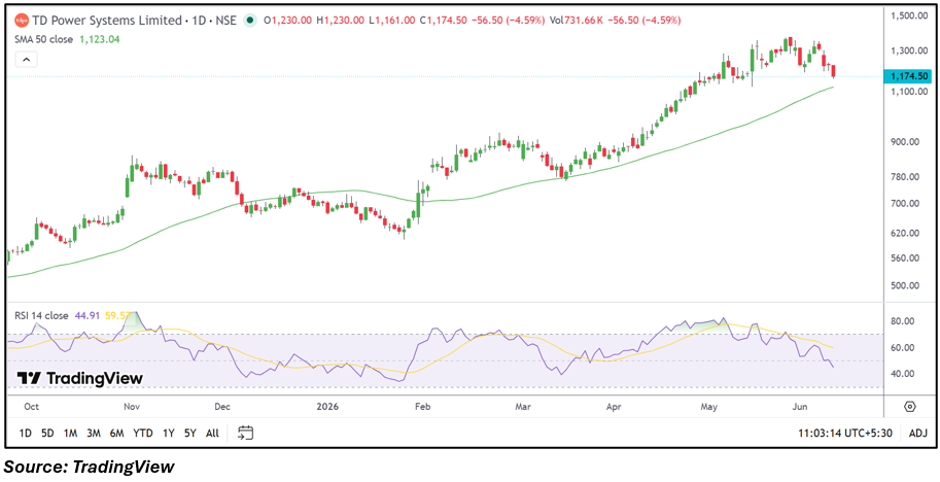
TD Power Systems is trading at ₹1,173.50, down 4.67% for the session. Despite the recent weakness, the stock remains above its 50-day SMA of ₹1,123.04, indicating that the broader price structure remains positive. The latest candles suggest some cooling in momentum after the stock rallied sharply over recent months. The RSI has eased to 44.91, moving below the neutral 50 mark and indicating a moderation in short-term momentum. While the ongoing correction has increased near-term caution, the stock continues to hold above its medium-term trend reference.
Momentum Indicator
The 14-day RSI stands at 44.91, reflecting weaker momentum compared with earlier readings. The indicator has slipped below 50, suggesting that buying momentum has softened as the stock undergoes consolidation after its recent rally.
Key Technical Levels
Technically, immediate support is placed near ₹1,114.83, which coincides closely with the 50-day SMA zone. A stronger downside support is visible around ₹1,056.15. On the upside, resistance is seen near ₹1,232.18, followed by a higher hurdle around ₹1,290.85. Price action around these levels could determine whether the stock resumes its broader uptrend or extends the ongoing correction.
Key Risks to Watch
- Profit booking may continue after the recent rally.
- RSI below 50 reflects weaker short-term momentum.
- ASM surveillance status could increase volatility.
- Failure to hold above the 50-day SMA may weaken sentiment.
Summary
TD Power Systems shares have entered a corrective phase after a strong upward move over recent months. Although short-term momentum has weakened, the stock continues to trade above its 50-day SMA and remains supported by profitable quarterly performance. Investors may watch whether the stock stabilizes near key support zones and whether momentum indicators begin to improve following the recent pullback.
FAQs
- Why did TD Power Systems shares fall today?
The stock declined amid profit booking after a strong rally and a moderation in short-term technical momentum. - Is TDPOWERSYS still above its 50-day SMA?
Yes, the stock remains above its 50-day SMA of ₹1,123.04 despite the recent correction. - What should investors monitor next?
Investors may track support levels, momentum indicators, and whether the stock can regain strength above recent resistance zones.