

Highlights
- Techno Electric shares declined 6.61% amid elevated post-results volatility.
- Net profit stood at INR 14,343.80 lakh in the March 2026 quarter.
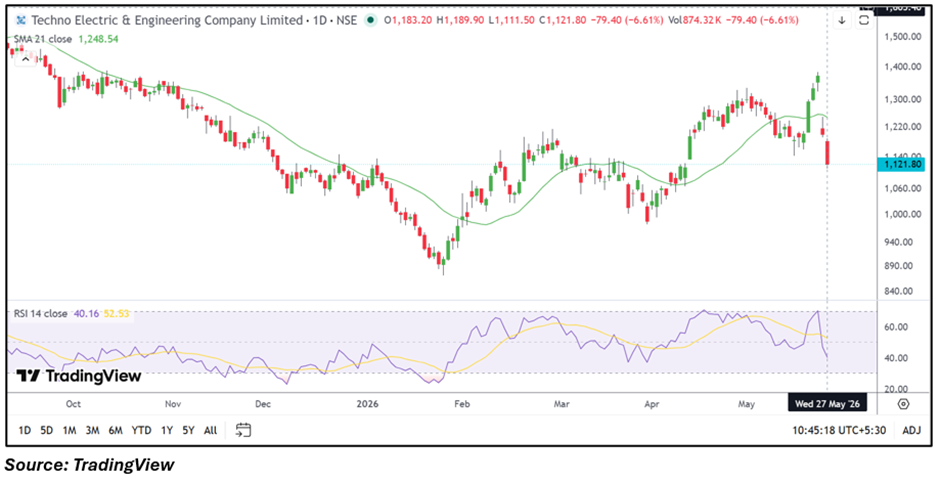
- Stock slipped below short-term moving average support during the session.
Overview
Techno Electric & Engineering Company Ltd. (NSE: TECHNOE) remained under pressure on May 27, with the stock falling 6.61% intraday after the latest quarterly earnings announcement. Investors appeared cautious amid heightened volatility and profit booking following the recent rally in the counter.
The stock opened at INR 1,183.20 and touched an intraday low of INR 1,111.50 before trading near INR 1,121.80 during the session.
Fundamental View
For the quarter ended March 2026, the company reported standalone total income of INR 1,09,597.00 lakh. Profit before tax came in at INR 17,411.30 lakh, while net profit stood at INR 14,343.80 lakh. Earnings per share for the quarter was reported at INR 12.33.
Despite the earnings growth, market participants remained cautious as the stock witnessed sharp volatility after its recent upward movement.
Technical View
Techno Electric stock traded near INR 1,121.80 while remaining below its 21-day moving average near INR 1,248.54, reflecting a weaker near-term structure. Recent price action indicates sharp selling pressure after the earlier rally, with the stock witnessing heavy intraday volatility. The 14-day RSI slipped near 40.16, moving below the neutral zone and indicating softer momentum conditions. Immediate support is placed in the INR 1,020.00–925.00 zone, while resistance is seen around INR 1,230.00–1,310.00 levels.
Key Technical Levels
The stock is witnessing immediate support near INR 1,020.00, followed by a broader support zone around INR 925.00. On the upside, resistance is visible near INR 1,230.00 and INR 1,310.00, where selling pressure may reappear.
Risks to Watch
- Continued profit booking may keep volatility elevated.
- Weak momentum below moving averages may pressure sentiment.
- Failure to hold INR 1,020.00 could increase downside risk.
- Broader market weakness may impact short-term recovery attempts.
Summary
Techno Electric shares remained under selling pressure despite reporting quarterly profit growth, as investors reacted cautiously following the recent rally in the stock. The counter slipped below key short-term levels and witnessed elevated volatility during the session. Traders are likely to monitor support near INR 1,020.00–925.00 and resistance around INR 1,230.00–1,310.00 for further directional cues.
FAQs
Why did Techno Electric shares fall today?
The stock declined amid post-results volatility and profit booking despite reporting higher quarterly earnings.
What were Techno Electric’s latest quarterly earnings?
The company reported net profit of INR 14,343.80 lakh and EPS of INR 12.33 for March 2026.
What are the important levels for TECHNOE stock?
Key support is near INR 1,020.00–925.00, while resistance is placed around INR 1,230.00–1,310.00.