

Highlights
- Thangamayil Jewellery shares hit the 10% lower circuit during Wednesday's session.
- The decline followed a strong rally over the past month, indicating profit booking.
- The stock continues to trade above its 50-day moving average despite the correction.
- RSI slipped toward the neutral zone after cooling from higher levels.
- Trading volumes remained elevated during the sharp decline.
- Investors will watch whether the stock stabilizes around key support levels.
Overview
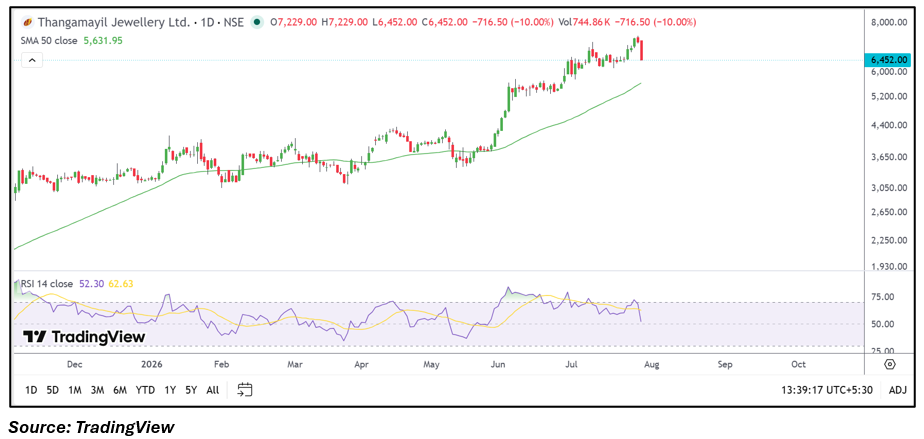
Thangamayil Jewellery Limited is one of India's leading jewellery retailers, engaged in the manufacture and sale of gold, diamond, silver, platinum, and precious stone jewellery. The company's shares fell 10% to ₹6,452.00 during Wednesday's session after hitting the lower circuit. The decline came after a strong rally over recent weeks, with profit booking emerging at higher levels even as the broader medium-term trend remained intact.
Fundamental View
For the quarter ended March 2026, Thangamayil Jewellery reported standalone total income of ₹2,83,917.00 lakh. Profit before tax stood at ₹18,221.00 lakh, while net profit came in at ₹14,266.00 lakh. Earnings per share were ₹45.89. The company continues to expand its retail presence across South India while benefiting from steady demand for gold jewellery. Investors will continue to monitor festive demand, gold price movements, and store expansion plans.
Technical View
The stock witnessed a sharp correction after an extended rally but continues to trade comfortably above its 50-day moving average of ₹5,631.95, indicating that the broader technical structure remains constructive. The 14-day RSI eased to 52.30 after retreating from higher levels, reflecting moderation in momentum following the recent decline. Price action suggests near-term volatility may persist, while holding above key support levels will be important for maintaining the prevailing trend.
Key Technical Levels
Immediate support is placed near ₹6,250.00, followed by the next support around ₹5,950.00. On the upside, immediate resistance is seen near ₹6,850.00, while the next important resistance is positioned around ₹7,200.00.
Risks to Watch
- Volatility in gold prices.
- Changes in consumer spending patterns.
- Higher inventory and financing costs.
- Intensifying competition in the jewellery sector.
- Broader market volatility.
Summary
Thangamayil Jewellery shares witnessed a sharp correction after a strong rally, resulting in a 10% lower circuit during Wednesday's session. While the recent decline reflects profit booking and weaker near-term momentum, the stock continues to trade above its key moving average, indicating that the broader trend remains intact. Market participants will closely monitor price stability, demand trends, and upcoming business developments.
FAQs
Q: Why did Thangamayil Jewellery shares hit the 10% lower circuit?
A: The decline was primarily driven by profit booking after the stock's strong rally in recent weeks, accompanied by increased market volatility.
Q: What business does Thangamayil Jewellery operate?
A: The company manufactures and retails gold, diamond, silver, platinum, and precious stone jewellery through an extensive retail network.
Q: How did the company perform in its latest reported quarter?
A: For the quarter ended March 2026, the company reported total income of ₹2,83,917.00 lakh and a net profit of ₹14,266.00 lakh.
Q: What is the current technical outlook for the stock?
A: The stock remains above its 50-day moving average, although the recent correction has weakened short-term momentum.
Q: What technical levels should investors monitor?
A: Immediate support is near ₹6,250.00, while resistance is placed around ₹6,850.00 and ₹7,200.00