
- Stock surges to ₹85.91, gaining 11.92% in today’s session
- Strong upward move pushes RSI above 85.00, indicating stretched momentum
- Price trades well above recent base, signaling continued bullish structure
Overview
Vidya Wires Limited (NSE: VIDYAWIRE) is trading near ₹85.91, gaining 11.92% in the session and extending its sharp upward trajectory seen over recent weeks. The stock has witnessed a strong breakout move, supported by consistent higher highs and higher lows, reflecting sustained upward momentum.
The current rally appears accelerated, with price action showing strong bullish candles and limited pullbacks. However, the sharp rise has also pushed the stock into overbought territory, raising the possibility of near-term consolidation.
Fundamental View
Vidya Wires reported steady financial performance for the quarter ended December 2025. The company posted total income of ₹44,881.50 lakh, while profit before tax stood at ₹2,064.70 lakh. Net profit came in at ₹1,542.20 lakh, translating into earnings per share of ₹0.72.
The consistent profitability and stable earnings profile support the broader constructive outlook. However, the recent sharp price movement appears largely driven by momentum rather than any immediate fundamental trigger, suggesting that price action is currently leading the narrative.
Technical View
Technically, Vidya Wires is in a strong upward trend, with the stock breaking out above recent consolidation zones and accelerating higher. The price structure shows a clear sequence of higher lows, reinforcing the bullish setup.
The latest candle reflects strong upward momentum, with price closing near the day’s high, indicating continued buying pressure. However, the steep angle of the rally suggests that the stock may be entering a phase of exhaustion in the short term.
Momentum Indicator
The 14-day RSI is currently around 85.74, which is well into overbought territory. While this reflects strong momentum, it also indicates that the stock may be stretched in the near term.
Historically, such elevated RSI levels are often followed by consolidation or minor pullbacks, rather than immediate continuation of sharp upside.
Key Technical Levels
The stock is approaching a resistance zone of ₹91.50–₹96.60, where the next phase of price action will be crucial. A sustained move above this band could extend the rally further, but the likelihood of resistance remains high given the stretched momentum.
On the downside, immediate support is placed at ₹81.50–₹77.40, which aligns with recent breakout levels. This zone could act as a cushion in case of profit booking or short-term correction.
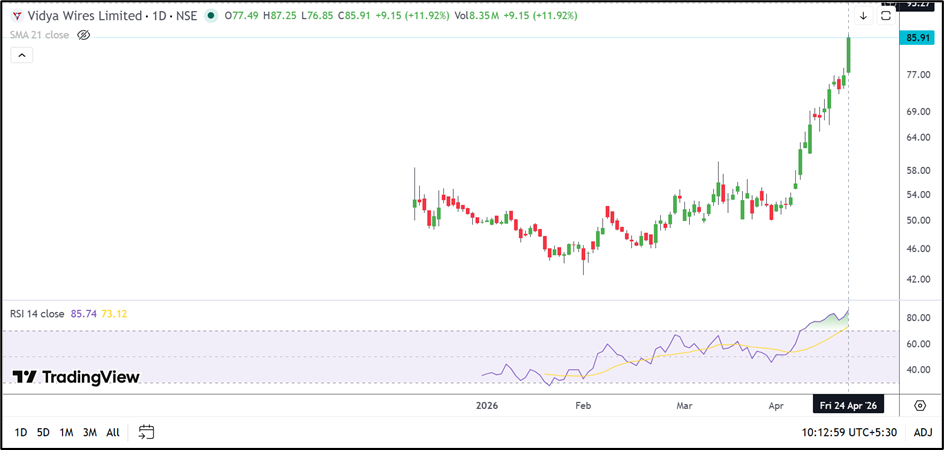
Source: TradingView
Risks To Watch
- Overbought RSI indicating stretched momentum
- Sharp rally increasing chances of profit booking
- Lack of immediate fundamental trigger supporting price surge
- Volatility due to low liquidity or sudden sentiment shifts
Summary
Vidya Wires is currently witnessing a strong momentum-driven rally, supported by a positive price structure and steady fundamentals. However, the sharp rise has pushed the stock into overbought territory, suggesting that near-term consolidation or mild correction cannot be ruled out.
While the broader trend remains positive, traders may watch how the stock behaves near resistance levels and whether it can sustain above breakout zones.
FAQs
Why is Vidya Wires stock rising sharply?
The rally appears driven by strong momentum and breakout above key levels.
Is the stock overbought?
Yes, RSI near 85.74 indicates the stock is in overbought territory.
What are key levels to watch?
Support at ₹81.50–₹77.40 and resistance at ₹91.50–₹96.60.