
Highlights
- Vindhya Telelinks reported Q4 FY26 net profit of INR 1,984.59 lakh.
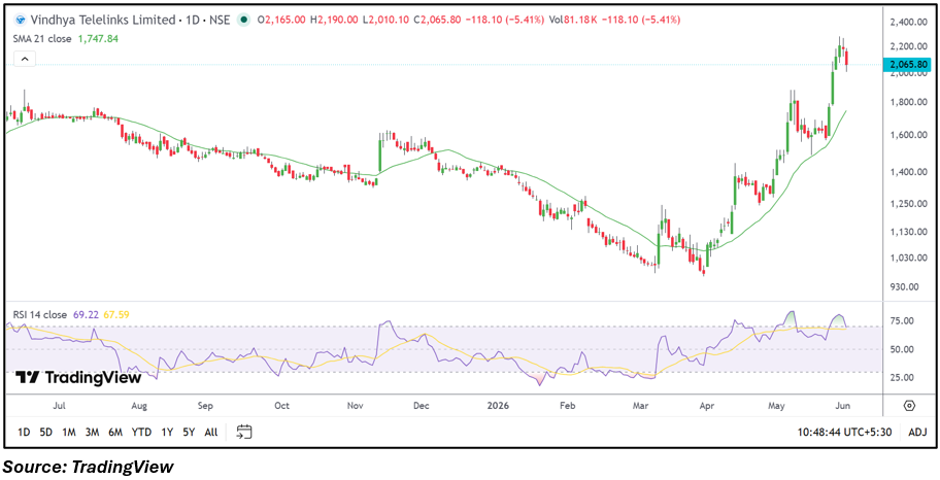
- The stock declined over 5% after a sharp rally to recent highs.
- Despite the pullback, shares remain well above the 21-day SMA.
Overview
Vindhya Telelinks (NSE: VINDHYATEL) witnessed profit booking on June 2, 2026, with the stock declining 5.41% to INR 2,065.80. The correction comes after a substantial rally over recent weeks that pushed the stock to fresh multi-month highs. While the latest quarterly results remained profitable, traders appeared to lock in gains following the sharp upward move.
Fundamental View
For the quarter ended March 31, 2026, Vindhya Telelinks reported total income of INR 1,00,730.39 lakh. Profit before tax stood at INR 2,592.60 lakh, while net profit was INR 1,984.59 lakh. Earnings per share came in at INR 16.75.
The company remained profitable during the quarter, supported by positive earnings generation. However, recent stock price action suggests market participants are assessing valuations and near-term momentum after the sharp appreciation seen in recent weeks.
Technical View
Vindhya Telelinks is trading at INR 2,065.80, down 5.41% for the session. Despite the decline, the stock remains comfortably above its 21-day SMA of INR 1,747.84, indicating that the broader near-term trend remains positive. Recent price action reflects a cooling phase after an extended rally, with traders booking profits near recent highs. The 14-day RSI stands at 69.22, remaining close to overbought territory and indicating momentum is still elevated despite the latest pullback. Sustained trading above the 21-day SMA may help preserve the current trend structure.
Momentum Indicator
The 14-day RSI is at 69.22, remaining near the overbought threshold of 70. This suggests momentum remains elevated, although the latest decline indicates some moderation after the recent advance.
Key Technical Levels
Based on the current price of INR 2,065.80, immediate support is placed near INR 1,962.51, representing approximately 5% below current levels. A stronger support zone is seen near INR 1,859.22, around 10% below the current market price. On the upside, the first resistance level is positioned near INR 2,169.09, about 5% above the current price. If the stock resumes its upward trajectory, the next resistance zone may emerge near INR 2,272.38, representing roughly 10% upside from current levels.
Risks to Watch
- Further profit booking after the recent rally.
- RSI remaining near overbought levels.
- Earnings volatility in upcoming quarters.
- Broader market weakness affecting mid-cap stocks.
Summary
Vindhya Telelinks reported profitable Q4 FY26 results with net profit of INR 1,984.59 lakh and EPS of INR 16.75. The stock corrected more than 5% after a sharp rally, indicating profit-booking activity near recent highs. While momentum has moderated, the stock continues to trade well above its 21-day SMA, keeping the broader near-term trend constructive.
FAQs
- What was Vindhya Telelinks' net profit in Q4 FY26?
The company reported net profit of INR 1,984.59 lakh for the quarter ended March 2026.
- Why did VINDHYATEL shares fall despite profitable earnings?
The decline appears linked to profit booking following a sharp rally rather than the quarterly earnings performance.
- What is the key technical indicator to watch?
Investors may monitor the RSI and the 21-day SMA to assess momentum and trend strength.