

Highlights
- Vishnu Prakash R Punglia (NSE: VPRPL) gained 19.98% to ₹37.11 on August 10, 2026.
- The stock opened at ₹32.50 and touched an intraday high of ₹37.11.
- March 2026 total income stood at ₹10,453.30 million, while net loss was ₹13,079.00 million.
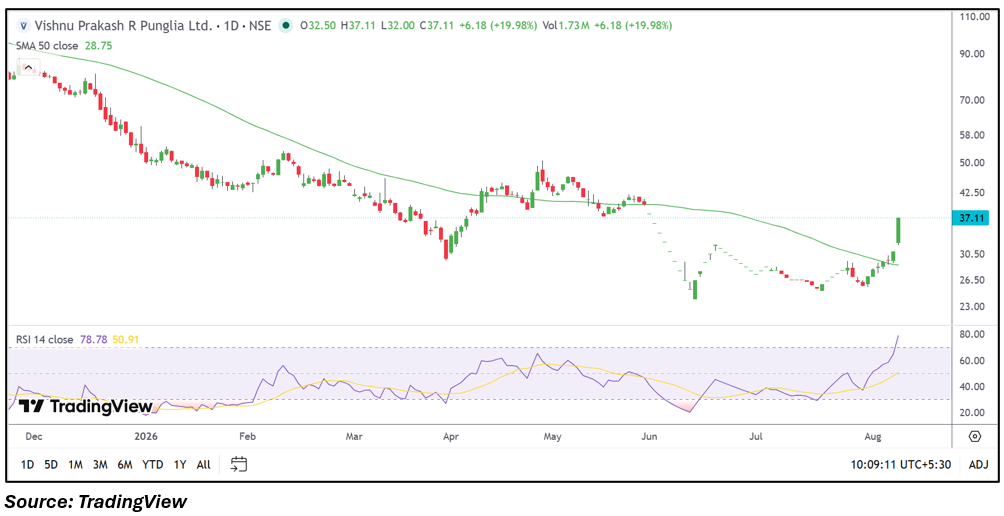
- The share price moved above its 50-day SMA of ₹28.75 during the latest session.
- RSI 14 climbed to 78.78, indicating elevated short-term momentum.
- Investors should monitor profitability, project execution, order flows, volumes and subsequent financial results.
Overview
Vishnu Prakash R Punglia (NSE: VPRPL) operates in the infrastructure sector, with business activities focused on water supply, sewerage and related engineering projects. The stock advanced 19.98% to ₹37.11 on August 10, 2026, compared with the previous close of ₹30.93. It opened at ₹32.50 and moved to an intraday high of ₹37.11, while the low stood at ₹32.00. VWAP was ₹36.06. The sharp move came as the stock extended its recent recovery and moved substantially above the 50-day moving average, resulting in a notable market reaction and increased attention to its short-term price structure.
Fundamental View
For the quarter ended March 31, 2026, Vishnu Prakash R Punglia reported standalone total income of ₹10,453.30 million. Profit before tax was negative at ₹15,176.90 million, while net loss stood at ₹13,079.00 million. Earnings per share was negative at ₹10.49. The reported numbers highlight considerable pressure on profitability despite the company's infrastructure-focused business operations. Future financial monitoring points include project execution, order inflows, operating margins, working-capital requirements, debt levels and the company's ability to improve earnings in subsequent quarters.
Technical View
The daily chart shows a sharp recovery in the stock, with the latest session taking the price to ₹37.11 and clearly above the 50-day SMA of ₹28.75. The stock had spent an extended period below the moving average before the recent recovery. RSI 14 has risen sharply to 78.78, moving above the commonly watched 70 level and indicating elevated momentum. Trading volume stood at 1.73 million shares. The latest price structure represents a significant expansion from the recent ₹25.00-₹30.50 region, while the move above the moving average has changed the near-term chart structure.
Key Technical Levels
Immediate support is near ₹32.00, which corresponds with the latest session's low. The next support is around ₹30.93, close to the previous closing price, followed by the 50-day SMA at ₹28.75. Immediate resistance is around ₹37.11, the latest intraday high. The next visible resistance zone is near ₹42.50, based on the previous trading structure visible on the daily chart.
Risks to Watch
- The March 2026 quarter recorded a substantial net loss.
- RSI at 78.78 reflects elevated short-term momentum.
- The stock has experienced considerable historical price volatility.
- Project execution and working-capital requirements can affect financial performance.
- Future price structure may depend on subsequent earnings and business developments.
Summary
Vishnu Prakash R Punglia (NSE: VPRPL) advanced 19.98% to ₹37.11, with the latest move taking the stock above its 50-day SMA of ₹28.75. RSI at 78.78 points to elevated momentum following the sharp recovery, while trading volume reached 1.73 million shares. Fundamentally, the March 2026 results showed total income of ₹10,453.30 million alongside a net loss of ₹13,079.00 million, keeping profitability a key monitoring area. Future developments around project execution, order inflows, margins, working capital, financial results and the sustainability of the recent technical move remain important.
FAQs
Q: What was the latest share price of Vishnu Prakash R Punglia (NSE: VPRPL)?
A: The stock was trading at ₹37.11 on August 10, 2026, up 19.98% from the previous close of ₹30.93.
Q: What were the latest financial results of VPRPL?
A: For the March 2026 quarter, total income was ₹10,453.30 million and net loss was ₹13,079.00 million, with EPS at negative ₹10.49.
Q: What does the technical chart indicate for Vishnu Prakash R Punglia (NSE: VPRPL)?
A: The stock has moved above its 50-day SMA of ₹28.75, while RSI at 78.78 indicates elevated short-term momentum.
Q: What are the important technical levels for VPRPL?
A: The immediate support is around ₹32.00, followed by ₹30.93 and ₹28.75. Resistance is visible near ₹37.11 and ₹42.50.
Q: What should investors monitor in VPRPL?
A: Investors should monitor profitability, project execution, order inflows, margins, working capital, trading volumes and subsequent quarterly results.