

Highlights
- TECIL Chemicals and Hydro Power Limited (NSE: TECILCHEM) fell 8.71% to ₹8.39 on August 10, 2026.
- The latest available results showed total income of ₹0.01 crore and a net loss of ₹16.46 crore.
- The stock opened at ₹8.60, reached ₹9.61 and touched an intraday low of ₹8.32.
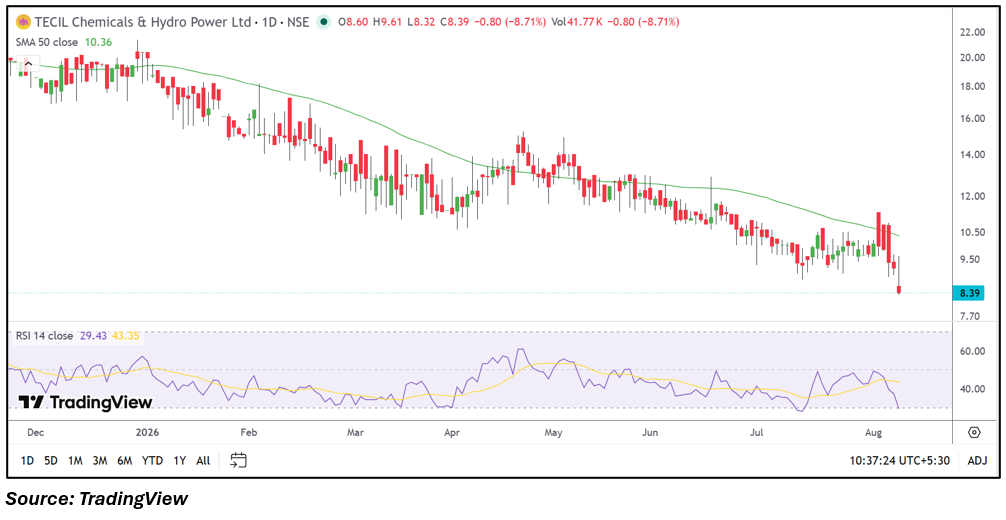
- Price remained below the 50-day SMA of ₹10.36, keeping the broader technical structure weak.
- Trading volume stood at approximately 41.77 thousand shares, with VWAP at ₹8.53.
- Investors should monitor profitability, revenue generation, the ₹8.32 low and price behaviour around the 50-day SMA.
Overview
TECIL Chemicals and Hydro Power Limited (NSE: TECILCHEM) operates in the chemicals and hydro power segments. The stock declined 8.71% to ₹8.39 on August 10, 2026, from the previous close of ₹9.19. It opened at ₹8.60, touched a high of ₹9.61 and declined to ₹8.32, while VWAP stood at ₹8.53. The latest movement came amid a weak longer-term price structure, with the stock remaining below its 50-day SMA. The company’s latest available financial results also continue to show pressure on profitability, keeping the market focus on future business performance and subsequent price action.
Fundamental View
For the quarter ended March 31, 2026, TECIL Chemicals reported standalone total income of ₹0.01 crore, while profit before tax was a loss of ₹16.46 crore and net loss was ₹16.46 crore. Earnings per share stood at negative ₹0.09. The figures indicate continued financial pressure, with reported income remaining extremely limited relative to the loss recorded during the quarter. Future financial updates will be important for assessing whether revenue generation improves and whether operating costs can be brought under control. Investors should monitor revenue, margins, cash flows, business activity and any improvement in profitability in subsequent quarters.
Technical View
The stock remains in a weak technical structure, trading at ₹8.39 below its 50-day SMA of ₹10.36. The moving average is positioned significantly above the current price, keeping the medium-term trend under pressure. RSI 14 stands at 29.43, slipping below the conventional 30 level and indicating an oversold reading. However, an oversold RSI does not by itself establish a recovery. The stock recorded a wide intraday range between ₹8.32 and ₹9.61, while volume was approximately 41.77 thousand shares. The latest price action therefore reflects continued volatility and weak momentum.
Key Technical Levels
Immediate support is around ₹8.32, based on the latest intraday low. The next support is near ₹8.00, which represents a psychological price level below the current market price. Immediate resistance is around ₹9.19, corresponding to the previous close. The next resistance is near ₹9.61, the latest intraday high, followed by the 50-day SMA at ₹10.36. These levels provide reference points for tracking the stock's evolving price structure.
Risks to Watch
- Continued losses could keep financial performance under pressure.
- Extremely low reported income highlights uncertainty around business activity.
- The stock remains significantly below its 50-day SMA of ₹10.36.
- RSI below 30 indicates an oversold reading but does not confirm a reversal.
- Sharp intraday price movements can result in elevated short-term volatility.
Summary
TECIL Chemicals (NSE: TECILCHEM) declined 8.71% to ₹8.39, with the stock trading below its 50-day SMA of ₹10.36 and RSI at 29.43. The latest available financial results showed total income of ₹0.01 crore and a net loss of ₹16.46 crore for the March 2026 quarter. The ₹8.32 intraday low and ₹9.61 high highlight the stock's current volatility. Going forward, revenue generation, profitability, cash flows, trading activity and price behaviour around ₹8.32, ₹9.61 and the 50-day SMA will remain important monitoring points.
FAQs
Q: What is TECIL Chemicals’ share price today?
A: TECIL Chemicals was trading at ₹8.39 on August 10, 2026, down 8.71% from the previous close.
Q: What was TECIL Chemicals’ latest net loss?
A: The company reported a standalone net loss of ₹16.46 crore for the quarter ended March 31, 2026.
Q: What is TECIL Chemicals’ 50-day SMA?
A: The 50-day SMA is ₹10.36, which is above the current market price of ₹8.39.
Q: What does the technical chart indicate for TECIL Chemicals?
A: The stock remains below its 50-day SMA, while RSI at 29.43 indicates an oversold reading and continued weak momentum.
Q: What should investors monitor in TECIL Chemicals?
A: Investors should monitor revenue generation, profitability, cash flows, trading volumes and price action around the ₹8.32 support and ₹9.61 resistance levels.