
Highlights
- SUNFLAG declined sharply after failing to hold near recent swing highs.
- The stock remains above its 50-day SMA despite the latest correction.
- Traders are watching whether key support zones can absorb selling pressure.
Overview
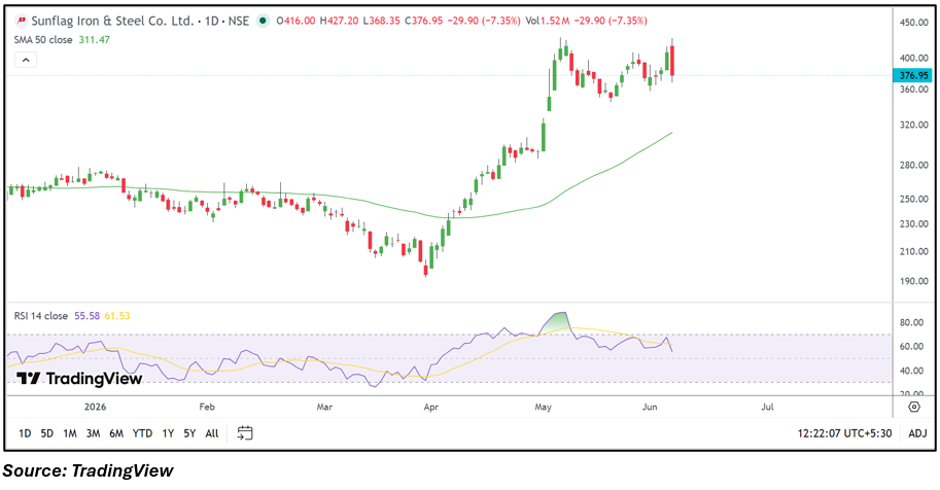
Sunflag Iron and Steel (NSE: SUNFLAG) fell 7.36% on June 5 to ₹376.90, emerging among the day's notable losers. The decline follows a strong rally from April lows that pushed the stock above ₹420.00 in recent sessions. While the latest move reflects increased profit booking, the broader trend remains constructive as the stock continues to trade above its 50-day Simple Moving Average (SMA).
Fundamental View
For the quarter ended March 2026, the company reported total income of ₹100,365.00 lakh, profit before tax of ₹8,101.00 lakh, and net profit of ₹3,395.00 lakh. Earnings per share stood at ₹1.88. The company remained profitable during the quarter, though the recent stock movement appears to be driven more by technical factors than fresh fundamental developments.
Technical View
SUNFLAG closed at ₹376.90, remaining above its 50-day SMA of ₹311.47. The stock witnessed a strong uptrend from April through May, forming higher highs and higher lows. However, the latest session produced a large bearish candle after the stock faced resistance near the ₹427.20 area. The pullback indicates near-term weakness, although the medium-term structure has not yet broken down. The 14-day RSI eased to 55.58, reflecting moderation in momentum after previously reaching stronger levels.
Momentum Indicator
The RSI at 55.58 remains above the neutral 50 mark but has moved lower from recent peaks. This suggests momentum has cooled and traders may continue to monitor whether RSI stabilizes or drifts lower in the coming sessions.
Key Technical Levels
SUNFLAG is approaching an important support region around ₹368.35, which corresponds to the recent session low and a near-term demand zone. If this level fails to hold, the stock could test the ₹350.00 region, where earlier consolidation activity was visible. On the upside, resistance is positioned near ₹406.85, followed by the recent swing high of ₹427.20. A move back above these levels would be required to restore bullish momentum and revive the broader uptrend.
Risks to Watch
- Further profit booking after the recent rally.
- Weakness in broader metal sector sentiment.
- Breakdown below near-term support levels.
- Rising volatility around resistance zones.
Summary
Sunflag Iron and Steel has entered a corrective phase after a strong multi-week advance. Despite the sharp decline, the stock continues to trade above its 50-day SMA of ₹311.47, indicating that the broader trend remains intact. The key focus now is whether buyers can defend support near ₹368.35. Holding above this zone could lead to consolidation and stabilization, while a break lower may increase the risk of a deeper pullback toward lower support levels.
FAQs
Why did SUNFLAG stock fall today?
The stock witnessed profit booking after a strong rally and faced resistance near recent highs.
Is the broader trend still positive?
Yes. SUNFLAG continues to trade above its 50-day SMA of ₹311.47 despite the latest correction.
What levels should traders monitor?
Support is seen near ₹368.35 and ₹350.00, while resistance is located around ₹406.85 and ₹427.20.