

Highlights
- Shanti Gold International reported its June 2026 quarterly financial performance with consolidated total income of ₹71,805.80 lakh.
- Profit before tax stood at ₹6,525.60 lakh, while net profit was ₹5,048.20 lakh.
- The stock opened at ₹258.90 and moved to a high of ₹259.99 and a low of ₹242.50.
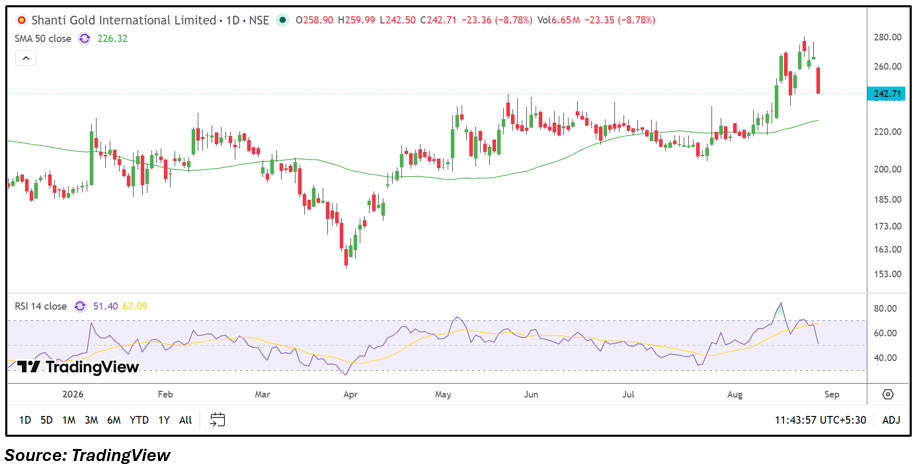
- The share is trading above its 50-day SMA of ₹226.32 despite the latest decline.
- Trading volume stood at around 6.65 million shares, indicating active market participation.
- Investors should monitor earnings growth, margins, RSI, volumes and the stock’s key technical levels.
Overview
Shanti Gold International Limited (NSE: SHANTIGOLD) is engaged in the jewellery manufacturing business, with its operations focused on gold jewellery products. The stock opened at ₹258.90, touched a high of ₹259.99 and a low of ₹242.50 before trading around ₹243.08, compared with the previous close of ₹266.07. VWAP stood at ₹248.73, while trading volume was around 6.65 million shares. The latest decline follows a period of sharp upward movement visible on the daily chart, with the stock having recently traded near higher levels. The price remains above its 50-day SMA, while the market reaction is focused on the latest correction, elevated trading activity and the company’s June quarter performance.
Fundamental View
For the quarter ended June 2026, Shanti Gold International reported consolidated total income of ₹71,805.80 lakh, profit before tax of ₹6,525.60 lakh and net profit of ₹5,048.20 lakh. EPS stood at ₹7.00. The net profit margin based on total income was approximately 7.03%. The reported figures provide a basis for tracking revenue generation, profitability and operating efficiency. Future quarters will be important for monitoring sales growth, margins, earnings consistency, working capital requirements and demand conditions within the jewellery market. Changes in gold prices, consumer spending and raw material costs could also influence the company’s financial performance.
Technical View
The daily chart shows that Shanti Gold remains above its 50-day SMA of ₹226.32 despite the latest decline. The stock recently moved into the ₹270.00 region before retreating toward ₹243.08. RSI 14 stands at 51.40, showing that momentum has moderated considerably from the elevated readings seen during the recent advance. The latest session recorded a high of ₹259.99 and a low of ₹242.50, while volume was around 6.65 million shares. The price relationship with the 50-day SMA, RSI movement and volume activity will remain important for assessing whether the current decline develops into consolidation or a deeper correction.
Key Technical Levels
Support is around ₹230.93, followed by ₹218.77. Resistance is around ₹255.23, followed by ₹267.39. The 50-day SMA at ₹226.32 remains an additional technical reference for the medium-term price structure.
Risks to Watch
- The stock has experienced significant price fluctuations across recent sessions.
- The latest decline has reduced momentum after the recent advance.
- RSI has moved lower from its earlier elevated reading.
- Changes in gold prices can affect jewellery manufacturing costs and margins.
- Future quarterly results will be important for assessing earnings consistency and business growth.
Summary
Shanti Gold International Limited (NSE: SHANTIGOLD) reported consolidated total income of ₹71,805.80 lakh, profit before tax of ₹6,525.60 lakh, net profit of ₹5,048.20 lakh and EPS of ₹7.00 for the June 2026 quarter. The stock is currently trading around ₹243.08 and remains above its 50-day SMA of ₹226.32 despite the latest decline. RSI at 51.40 indicates that momentum has moderated, while elevated volume highlights active trading. Going forward, investors should monitor quarterly earnings, margins, gold-price movements, trading volumes, RSI and the identified technical levels.
FAQs
Q: What is the latest share price of Shanti Gold International?
A: The stock was trading at ₹243.08 based on the latest market data provided.
Q: What were Shanti Gold International’s June quarter results?
A: Consolidated total income was ₹71,805.80 lakh, profit before tax was ₹6,525.60 lakh and net profit was ₹5,048.20 lakh.
Q: What is Shanti Gold International’s 50-day SMA?
A: The 50-day SMA shown on the chart is ₹226.32.
Q: What is the RSI of Shanti Gold International stock?
A: The RSI 14 reading shown on the chart is 51.40.
Q: What technical levels should investors monitor for SHANTIGOLD?
A: Support is around ₹230.93 and ₹218.77, while resistance is around ₹255.23 and ₹267.39.