

Highlights
- Nandan Denim Limited (NSE: NDL) is witnessing a sharp upward move during the latest trading session.
- June 2026 total income stood at ₹62,481.67 lakh, with net profit at ₹1,479.61 lakh.
- The stock was trading at ₹2.71, up 19.91% from the previous close of ₹2.26.
- Price has moved above the 50-day SMA of ₹2.40, while RSI 14 has risen to 74.33.
- Trading volume stood at approximately 3.80 million shares, reflecting heightened market activity.
- Investors should monitor price stability near the current high, volume behaviour, RSI and subsequent financial results.
Overview
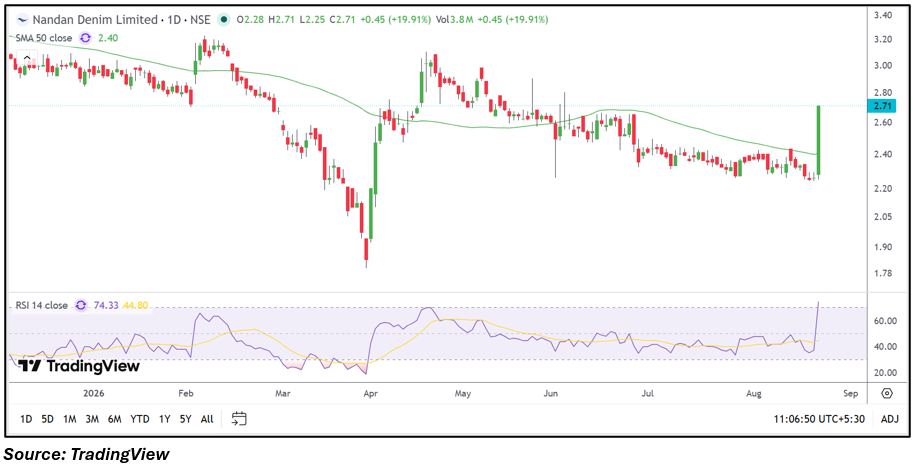
Nandan Denim Limited (NSE: NDL) operates in the denim and textile manufacturing business, with its operations focused on textile products and related activities. On 21 August 2026, Nandan Denim Limited (NSE: NDL) opened at ₹2.28 and moved to a high of ₹2.71, while the session low was ₹2.25. The stock was trading at ₹2.71, representing a gain of 19.91% from the previous close of ₹2.26. The VWAP stood at ₹2.55. The latest movement follows a prolonged period of consolidation and weakness visible on the daily chart, with the stock recently trading around the ₹2.25-₹2.40 range. The sharp rise has taken the price above the 50-day SMA and has been accompanied by volume of approximately 3.80 million shares.
Fundamental View
For the quarter ended 30 June 2026, Nandan Denim Limited (NSE: NDL) reported standalone total income of ₹62,481.67 lakh, profit before tax of ₹1,031.51 lakh and net profit of ₹1,479.61 lakh. Earnings per share stood at ₹0.10. Based on the reported figures, profit before tax represented approximately 1.65% of total income, while net profit represented around 2.37%. The quarterly figures provide a basis for tracking revenue performance, profitability and earnings consistency. Going forward, monitoring points include textile demand, operating margins, raw material costs, production volumes, debt-related costs and the sustainability of profitability across subsequent quarters.
Technical View
The daily chart shows a sharp recovery from the recent trading zone around ₹2.25-₹2.40. Nandan Denim Limited (NSE: NDL) is currently trading at ₹2.71, well above its 50-day SMA of ₹2.40. The latest candle has reached the visible high of ₹2.71, while RSI 14 has climbed to 74.33, moving above the conventional 70 level. The RSI rise indicates elevated short-term momentum following the latest price advance. Trading volume of approximately 3.80 million shares is substantially active alongside the price movement. The current structure therefore shows a strong short-term acceleration, while subsequent sessions will indicate whether the move develops into sustained momentum or consolidation.
Key Technical Levels
The ₹2.40 area, corresponding to the 50-day SMA, is a visible chart reference for the current structure, while the ₹2.25-₹2.30 zone represents the recent consolidation area and latest session low region. On the upside, ₹2.71 is the current visible high and the immediate reference from the latest price action, followed by the ₹2.80-₹3.00 zone where earlier price activity is visible on the chart. These levels can be monitored alongside volume and RSI to understand how the latest move develops.
Risks to Watch
- RSI at 74.33 indicates elevated short-term momentum.
- A move back below the 50-day SMA of ₹2.40 could weaken the recent recovery structure.
- Sharp single-session gains can lead to increased price volatility.
- A decline in trading volume could affect the sustainability of the latest price movement.
- Future quarterly margins, textile demand and raw material costs remain important financial factors.
Summary
Nandan Denim Limited (NSE: NDL) is showing a significant change in its short-term price structure, with the stock trading at ₹2.71 after gaining 19.91% in the latest session. The June 2026 quarter reported total income of ₹62,481.67 lakh and net profit of ₹1,479.61 lakh, while EPS stood at ₹0.10. Technically, Nandan Denim Limited (NSE: NDL) has moved above its 50-day SMA of ₹2.40, with RSI at 74.33 and trading volume around 3.80 million shares. The ₹2.40 SMA area, ₹2.25-₹2.30 consolidation zone and ₹2.71 current high are important visible references. Future price behaviour, volumes, RSI, margins and subsequent quarterly performance will remain relevant for assessing the stock's evolving structure.
FAQs
Q: What is Nandan Denim Limited's latest share price?
A: Nandan Denim Limited (NSE: NDL) was trading at ₹2.71 on 21 August 2026 based on the provided market data.
Q: What was Nandan Denim Limited's net profit in June 2026?
A: Nandan Denim Limited reported a net profit of ₹1,479.61 lakh for the quarter ended 30 June 2026.
Q: What is Nandan Denim Limited's 50-day SMA?
A: The 50-day SMA shown on the daily chart is ₹2.40.
Q: What is the current RSI of Nandan Denim Limited?
A: The RSI 14 reading shown on the chart is 74.33.
Q: What should investors monitor in Nandan Denim Limited?
A: Investors can monitor price behaviour around ₹2.40, the current high of ₹2.71, trading volume, RSI movements, textile-sector conditions, margins and subsequent quarterly results.