

Highlights
- Regency Ceramics shares gained 19.98% on August 12, 2026, placing the stock among the notable movers during the session.
- The latest available audited results reported total income of ₹1,168.46 lakh, while profit before tax and net profit stood at a loss of ₹1,249.40 lakh.
- The stock opened at ₹37.25 and touched a high of ₹38.86, compared with an intraday low of ₹34.61.
- The latest price moved above the 50-day SMA of ₹37.87, changing the short-term price structure.
- Trading volume stood at approximately 21.44 thousand shares, while VWAP was ₹38.37.
- Investors should monitor financial performance, trading participation, the ability to sustain the latest price move and future corporate developments.
Overview
Regency Ceramics (NSE: REGENCERAM) is engaged in the ceramic products business, with its operations focused on the manufacturing and sale of ceramic tiles and related products. The stock gained 19.98% on August 12, 2026, rising from the previous close of ₹32.39 to ₹38.86. It opened at ₹37.25 and reached a high of ₹38.86, while the low stood at ₹34.61. VWAP was ₹38.37 and trading volume was approximately 21.44 thousand shares. The sharp move lifted the stock above its 50-day SMA and brought the counter back into focus after a prolonged period of weakness visible on the daily chart.
Fundamental View
The latest available audited standalone results for the quarter ended March 31, 2026, showed total income of ₹1,168.46 lakh. Profit before tax was a loss of ₹1,249.40 lakh, while net profit was also a loss of ₹1,249.40 lakh. EPS stood at negative ₹4.73. The reported financial figures indicate continued pressure on profitability, making future operating performance an important factor for assessing the company's financial trajectory. Investors should monitor revenue recovery, cost control, margins, production activity, cash flows and any developments that could influence the company's operating performance in subsequent reporting periods.
Technical View
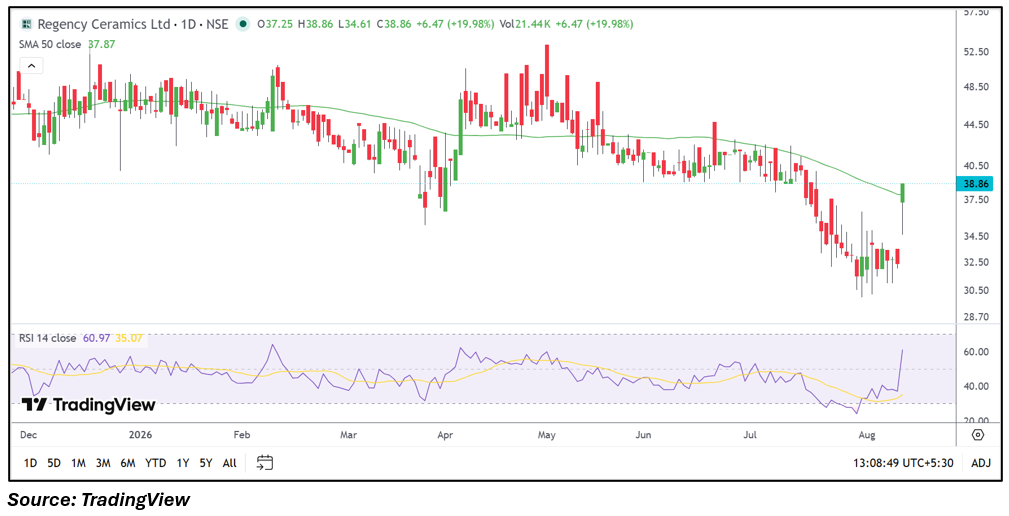
The daily chart shows a sharp recovery from the recent lower trading zone, with the latest price of ₹38.86 moving above the 50-day SMA of ₹37.87. The stock had remained below the moving average through much of the recent decline before the latest session pushed the price back above it. RSI 14 has risen to 60.97 from significantly lower levels seen recently, indicating an improvement in short-term momentum. The session ranged from ₹34.61 to ₹38.86, while volume was approximately 21.44 thousand shares. The price structure has therefore changed noticeably in the latest session, although the longer chart still reflects a history of substantial volatility.
Key Technical Levels
Immediate support is around ₹38.37, corresponding to the latest VWAP. Next support is near ₹37.87, around the 50-day SMA. Immediate resistance is around ₹38.86, the latest session high. Next resistance is near ₹40.50, followed by the ₹42.00 region based on the visible recent chart structure.
Risks to Watch
- The latest available financial results showed a net loss of ₹1,249.40 lakh.
- EPS remained negative at ₹4.73 for the reported period.
- The stock has historically displayed significant price volatility.
- Trading volume of approximately 21.44 thousand shares indicates relatively limited participation compared with larger listed companies.
- Sustaining the move above the 50-day SMA will remain important for the short-term technical structure.
Summary
Regency Ceramics (NSE: REGENCERAM) advanced 19.98% to ₹38.86 on August 12, 2026, following a prolonged period of weakness visible on the daily chart. The latest price moved above the 50-day SMA of ₹37.87, while RSI improved to 60.97, indicating stronger short-term momentum. However, the latest available audited results showed total income of ₹1,168.46 lakh and a net loss of ₹1,249.40 lakh, highlighting continued fundamental pressure. Going forward, investors should monitor financial recovery, operating performance, trading activity and whether the stock can maintain its latest technical recovery.
FAQs
Q: What happened to Regency Ceramics shares on August 12, 2026?
A: Regency Ceramics shares rose 19.98%, moving from the previous close of ₹32.39 to ₹38.86 during the session.
Q: What were Regency Ceramics' latest available financial results?
A: The latest audited results reported total income of ₹1,168.46 lakh, profit before tax of negative ₹1,249.40 lakh and net profit of negative ₹1,249.40 lakh.
Q: What are Regency Ceramics' 50-day SMA?
A: The 50-day SMA shown on the chart is ₹37.87, while the latest market price is ₹38.86.
Q: What does the RSI indicate for Regency Ceramics?
A: RSI 14 is at 60.97, reflecting an improvement in short-term momentum after the recent recovery.
Q: What should investors monitor in Regency Ceramics?
A: Investors should monitor revenue recovery, profitability, operating performance, trading volume and the sustainability of the stock's move above the 50-day SMA.