

Highlights
- Indo Count Industries is witnessing a sharp recovery during Tuesday’s trading session after recent weakness.
- June 2026 total income stood at ₹83,972.19 lakh, while net profit was ₹6,678.27 lakh.
- The stock was trading at ₹432.65, compared with the previous close of ₹388.70.
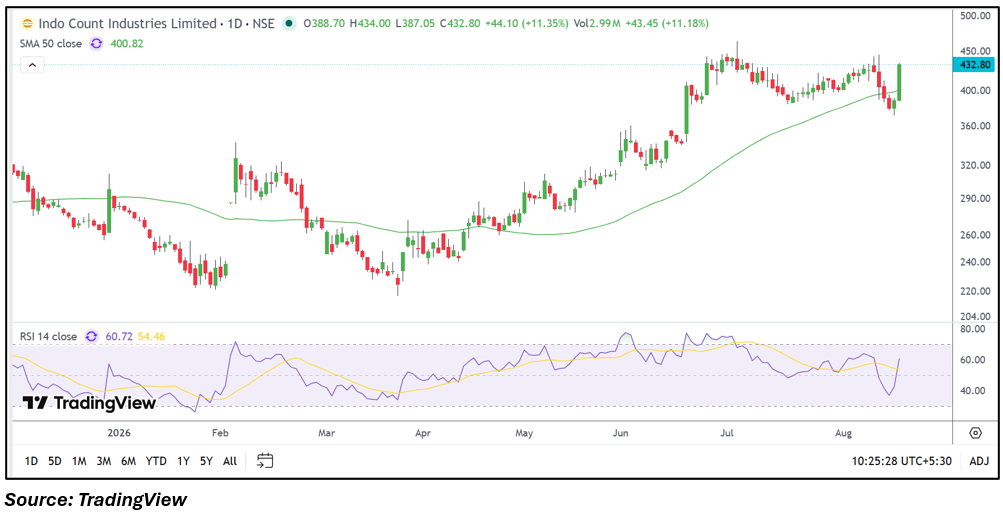
- The price has moved above the 50-day SMA of ₹400.82, improving the immediate chart structure.
- Trading volume stood at 2.99 million shares, with VWAP at ₹422.17 during the session.
- Investors should monitor whether the recovery sustains, along with volumes, momentum, business performance and upcoming developments.
Overview
Indo Count Industries Limited (NSE: ICIL) is a textile manufacturer focused on home textiles and related products, serving domestic and international markets. On August 18, 2026, the stock was trading at ₹432.65, up 11.31% from the previous close of ₹388.70. It opened at ₹388.70, touched a high of ₹433.55 and a low of ₹387.05, while VWAP stood at ₹422.17. The latest move represents a sharp recovery after the stock had recently weakened from the upper end of its trading range. The price action has brought the stock back above its 50-day moving average and near recent swing highs, placing the latest market movement under close observation.
Fundamental View
For the quarter ended June 30, 2026, Indo Count Industries reported standalone total income of ₹83,972.19 lakh, profit before tax of ₹9,087.42 lakh and net profit of ₹6,678.27 lakh. Earnings per share stood at ₹3.37. The quarterly figures indicate continued profitability, while future performance will depend on textile demand, export conditions, raw-material costs, operating expenses and international market conditions. Investors will also monitor subsequent revenue growth, margins and earnings consistency. The latest quarterly results were released more than three days ago and therefore are not being treated as the immediate headline trigger for Tuesday’s stock movement.
Technical View
The daily chart shows that Indo Count Industries has been in a broader upward structure, although the stock recently experienced a correction from higher levels. Tuesday’s recovery has pushed the price back above the 50-day SMA of ₹400.82. RSI 14 is at 60.72, recovering from the recent decline and moving above the midpoint of its conventional range. The latest session is also accompanied by volume of 2.99 million shares, while the price remains above VWAP of ₹422.17. The combination of the recovery candle, elevated volume and position above the moving average indicates a notable change in short-term price momentum, although subsequent sessions will determine whether the move is sustained.
Key Technical Levels
Support is visible around ₹410.02, followed by a lower support zone near ₹389.39. Resistance can be observed around ₹454.28, while the next resistance zone is near ₹475.92. The 50-day SMA at ₹400.82 remains an additional technical reference for assessing the stock’s medium-term price structure.
Risks to Watch
- The latest sharp recovery could be followed by renewed short-term volatility.
- Failure to sustain levels above the 50-day SMA could weaken the recent technical improvement.
- International textile demand remains important for future business performance.
- Raw-material costs and currency movements can influence margins.
- Future earnings growth and operating margins require continued monitoring.
Summary
Indo Count Industries has staged a notable turnaround in Tuesday’s session after recent price weakness, with the stock trading at ₹432.65 and moving above its 50-day SMA of ₹400.82. The June 2026 quarter showed total income of ₹83,972.19 lakh and net profit of ₹6,678.27 lakh, while the latest session has been accompanied by substantial trading volume. RSI has also recovered to 60.72, indicating improved short-term momentum. Going forward, price stability, trading volumes, textile demand, margins, export conditions and subsequent financial results will remain important factors for monitoring the stock’s evolving structure.
FAQs
Q: What is behind the latest turnaround in Indo Count Industries?
A: The stock is showing a sharp recovery after recent weakness, supported by increased trading activity and a move back above its 50-day SMA.
Q: What is Indo Count Industries’ 50-day SMA?
A: The 50-day SMA shown on the daily chart is ₹400.82.
Q: What was Indo Count Industries’ net profit in June 2026?
A: The company reported a net profit of ₹6,678.27 lakh for the quarter ended June 30, 2026.
Q: What is Indo Count Industries’ current RSI?
A: The 14-day RSI shown on the chart is 60.72.
Q: Which technical levels should be monitored for Indo Count Industries?
A: Support can be monitored around ₹410.02 and ₹389.39, while resistance can be observed around ₹454.28 and ₹475.92.