

Highlights
- Pyramid Technoplast shares rallied more than 13% during Monday's trading session.
- The stock featured among the NSE's top gainers with increased trading activity.
- The company reported a standalone net profit of ₹1,001.86 lakh in its latest reported quarter.
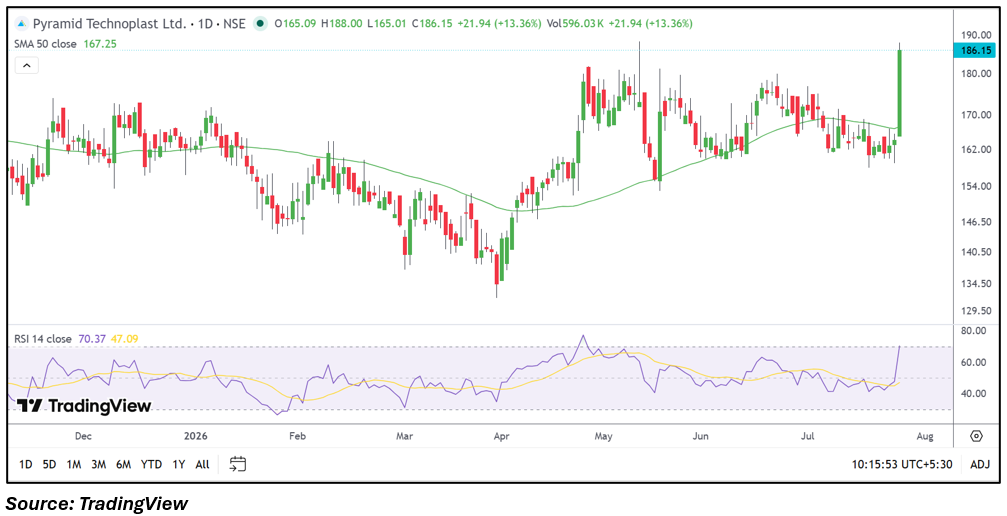
- The stock moved above its 50-day simple moving average.
- The 14-day RSI climbed above 70, indicating strong price momentum.
- Investors are likely to monitor earnings growth, demand trends, and future business developments.
Overview
Pyramid Technoplast Limited manufactures polymer-based industrial packaging products, including HDPE drums, intermediate bulk containers, and plastic containers for domestic and export markets. The company's shares climbed more than 13% to ₹185.60 during Monday's trading session, placing the stock among the top gainers on the NSE. The sharp move was accompanied by higher trading volumes, bringing the stock into focus after a strong intraday rally.
Fundamental View
For the quarter ended 31 March 2026, Pyramid Technoplast reported standalone total income of ₹19,553.23 lakh. Profit before tax stood at ₹1,437.36 lakh, while net profit came in at ₹1,001.86 lakh. Earnings per share was reported at ₹2.80. The company continues to serve industries such as chemicals, agrochemicals, pharmaceuticals, and specialty chemicals through its industrial packaging solutions. Going forward, investors are likely to monitor capacity utilisation, demand across end-user industries, revenue growth, and margin performance.
Technical View
Pyramid Technoplast witnessed a sharp breakout after moving above its 50-day simple moving average of ₹167.25. The latest price action reflects renewed upward momentum, with the stock reaching its highest level in recent weeks. The 14-day RSI stood at 70.37, indicating strong momentum following the sharp advance. Trading volumes also improved during the session, suggesting increased market participation as the stock extended its gains.
Key Technical Levels
Immediate support is placed near ₹178.00, followed by the next support around ₹172.00. On the upside, immediate resistance is seen near ₹188.00, while the next resistance is positioned around ₹195.00. These levels are likely to remain important for the stock's near-term price movement.
Risks to Watch
- Fluctuations in raw material prices.
- Slower demand from industrial customers.
- Pressure on operating margins.
- Changes in export demand.
- Competitive pricing within the packaging industry.
Summary
Pyramid Technoplast emerged among the top gainers after advancing more than 13% during Monday's trading session. The company remains profitable based on its latest quarterly results, while the stock's move above its 50-day moving average highlights improving technical strength. Investors are likely to monitor business expansion, earnings performance, demand trends, and margin movement in the coming quarters.
FAQs
Q: What triggered the 13% rally in Pyramid Technoplast shares?
A: The stock gained sharply amid increased trading activity, making it one of the top-performing stocks on the NSE during Monday's session.
Q: What were Pyramid Technoplast's latest quarterly results?
A: For the quarter ended 31 March 2026, the company reported standalone total income of ₹19,553.23 lakh, profit before tax of ₹1,437.36 lakh, and net profit of ₹1,001.86 lakh.
Q: Is Pyramid Technoplast profitable?
A: Yes. The company reported a standalone net profit of ₹1,001.86 lakh with earnings per share of ₹2.80 in its latest reported quarter.
Q: What does the technical outlook indicate?
A: The stock is trading above its 50-day moving average, while the RSI indicates strong momentum following the recent rally.
Q: What should investors monitor going forward?
A: Investors are likely to monitor revenue growth, capacity utilisation, raw material costs, operating margins, demand across end-user industries, and future quarterly performance.