
Highlights
- RMC Switchgears shares declined 5% and remained under sustained selling pressure.
- The stock continues to trade in a clear downtrend with lower highs and lower lows.
- RSI has slipped into oversold territory, highlighting weak momentum conditions.
Overview
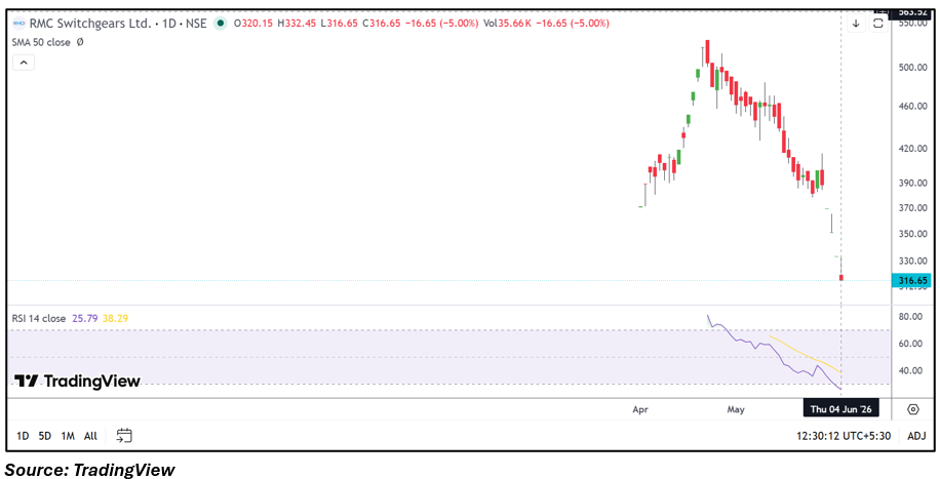
RMC Switchgears (NSE: RMC) remained under pressure on June 4, with the stock falling 5% to INR 316.65. The decline extends a broader corrective phase that has been in place for several weeks, with the stock retreating significantly from its recent highs above INR 500. Despite reporting profitable quarterly results, market participants have continued to reduce exposure as technical weakness persists.
Fundamental View
For the quarter ended March 2026, RMC Switchgears reported consolidated total income of INR 14,358.86 lakh. Profit before tax stood at INR 1,294.54 lakh, while net profit came in at INR 926.54 lakh. Earnings per share for the quarter was INR 8.81.
The company remains profitable at the operational level. However, recent market action suggests that traders are focusing more on the ongoing technical deterioration and profit-booking activity following the stock's earlier rally.
Technical View
RMC Switchgears is currently trading at INR 316.65 and remains in a pronounced downtrend on the daily chart. Recent price action reflects persistent selling pressure, with the stock continuing to form lower highs and lower lows after peaking above INR 500.
The 14-day RSI has dropped to 25.79, indicating oversold conditions and highlighting the intensity of the recent decline. While oversold readings can sometimes precede short-term rebounds, the broader trend remains weak until the stock begins establishing higher highs and stronger price stability.
Momentum Indicator
Momentum remains negative, with RSI at 25.79. The indicator has slipped well below the neutral 50 mark and entered oversold territory, reflecting weak buying interest and continued downside pressure.
Key Technical Levels
Based on the current market price of INR 316.65, immediate support is placed near INR 300.82, while a stronger support zone is seen around INR 284.99. On the upside, the stock may face immediate resistance near INR 332.48, with the next resistance level positioned around INR 348.32. A move above resistance levels may help stabilize sentiment, while a break below support zones could keep pressure on the stock.
Risks to Watch
- Continued lower-high and lower-low formation.
- Weak momentum reflected in oversold RSI readings.
- High volatility associated with BE-category stocks.
- Further profit booking following the recent correction.
Summary
RMC Switchgears continues to face selling pressure, with the stock extending its decline and trading near recent lows. Although the company reported profitable quarterly results, the market remains focused on the weak technical setup. The stock's RSI has entered oversold territory, but the broader trend remains negative until price action begins to stabilize. Traders are likely to monitor support near INR 300.82 and INR 284.99, while resistance levels are seen around INR 332.48 and INR 348.32.
FAQs
Why is RMC Switchgears stock falling today?
The stock is witnessing continued selling pressure as its broader corrective trend remains intact.
Is RMC Switchgears in an oversold zone?
Yes. The 14-day RSI stands at 25.79, indicating oversold market conditions.
What are the key levels to watch?
Support is seen near INR 300.82 and INR 284.99, while resistance is located around INR 332.48 and INR 348.32.