
Highlights
- Mohit Industries shares declined more than 8% during the session.
- The stock slipped below its 50-day SMA, indicating weakening momentum.
- Recent selling pressure has pushed the stock toward an important support zone.
Overview
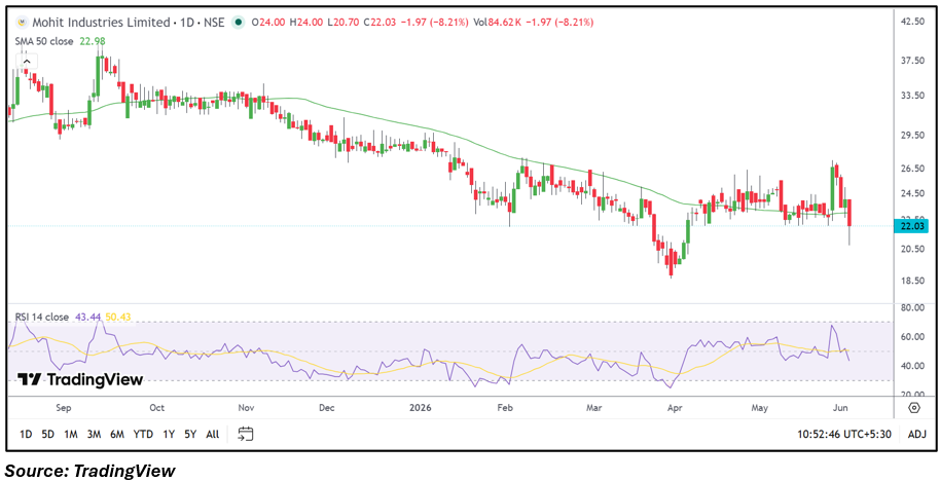
Mohit Industries (NSE: MOHITIND) remained under pressure on June 3, with the stock falling 8.21% to INR 22.03. The decline came shortly after the company reported its March 2026 quarter results, and the stock erased a large portion of its recent recovery gains. The sharp pullback has shifted market focus toward the stock's technical structure and whether current support levels can hold.
Fundamental View
For the quarter ended March 2026, Mohit Industries reported consolidated total income of INR 3,752.20 lakh. Profit before tax stood at a loss of INR 15.20 lakh, while net profit was INR 6.59 lakh. Earnings per share came in at INR 0.05.
Although the company reported a marginal net profit, the weak profitability profile and loss at the pre-tax level may have contributed to cautious investor sentiment following the results announcement.
Technical View
MOHITIND is currently trading at INR 22.03, below its 50-day SMA of INR 22.98, reflecting a weak near-term technical structure. Recent price action shows the stock facing rejection near the INR 26 zone before reversing sharply lower.
The 14-day RSI stands near 43.44, below the neutral 50 mark, indicating fading momentum. The indicator suggests that sellers currently hold a modest advantage after the recent decline.
Momentum Indicator
Momentum has weakened noticeably after the stock failed to sustain its recent rebound. The RSI has slipped below its signal line and remains under the midpoint level, highlighting a loss of upside strength in the near term.
Key Technical Levels
The immediate support level is placed near INR 20.93. If the stock fails to hold this zone, the next support level is located around INR 19.83.
On the upside, the first resistance is positioned near INR 23.13. A sustained recovery above this level could bring the next resistance zone near INR 24.23 into focus.
Risks to Watch
- Weak momentum could keep pressure on the stock.
- Breakdown below support may trigger additional selling.
- Low profitability may weigh on sentiment.
- Volatility can increase around earnings reactions.
Summary
Mohit Industries (NSE: MOHITIND) declined more than 8% as investors reacted to a modest quarterly performance and weakening technical conditions. The stock is now trading below its 50-day SMA, while RSI remains below the neutral mark, reflecting softer momentum. Support levels are placed near INR 20.93 and INR 19.83, while resistance is seen around INR 23.13 and INR 24.23. Market participants may closely watch whether the stock can stabilize near current levels.
FAQs
Why is Mohit Industries stock falling today?
The stock is facing selling pressure amid weak technical momentum and a cautious market reaction to quarterly earnings.
Is Mohit Industries profitable?
The company reported a net profit of INR 6.59 lakh for the March 2026 quarter, though profit before tax remained negative.
What are the important levels to watch in MOHITIND?
Key support levels are INR 20.93 and INR 19.83, while resistance levels are INR 23.13 and INR 24.23.