
Highlights
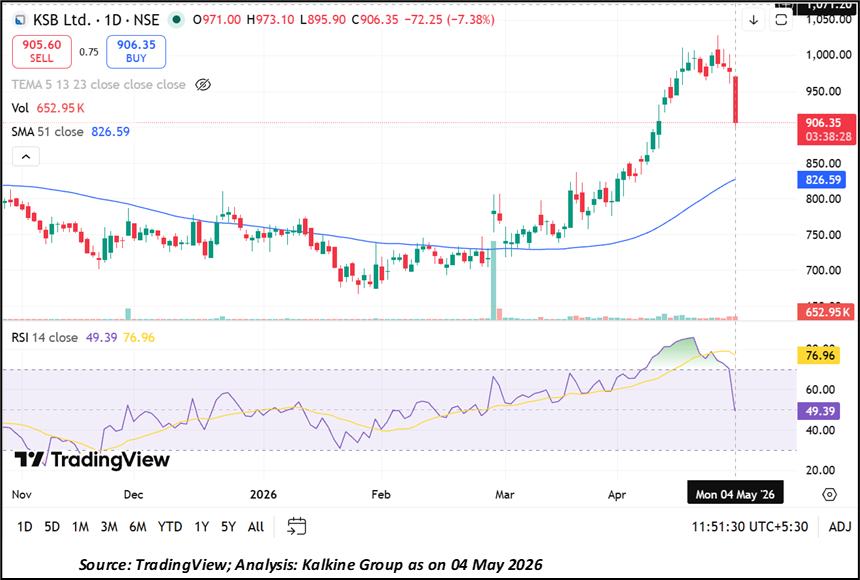
- The stock declined over 7% and is trading near ₹906 level.
- RSI near 49 shows neutral momentum with no strong trend.
- Price remains above 51-day SMA, indicating nearby support.
Shares of KSB (NSE:KSB) saw a drop in the latest session. The stock fell around 7.38% to ₹906.35, compared to the previous close of ₹978.60. It opened lower at ₹971.00 and moved between ₹895.90 and ₹973.10 during the session.
The traded volume stood at 6.56 lakh shares, with a traded value of ₹59.97 crore. The company has a total market cap of ₹15,771.43 crore and a free float market cap of ₹4,737.47 crore, showing mid-cap positioning.
Returns Remain Positive Over Time
The stock has shown mixed performance in the short term but remains positive over longer periods. In one week, it declined 9.35%, while the broader market gained 0.51%.
In one month, the stock gained 8.14%, slightly below the broader index return of 9.81%. Year-to-date, it is up 21.47%, compared to a decline of 3.81% in the index. Over one year, the stock gained 26.04%.
Over longer periods, the stock has delivered strong returns, rising 104.39% in three years and 419.39% over five years.
Trading Activity and Volatility
The stock has stable trading activity with an impact cost of 0.09, indicating good liquidity. The deliverable quantity stands at 47.31%, showing a balance between delivery-based and short-term trades.
Annualised volatility is 37.64, which is lower compared to many mid-cap stocks, suggesting relatively moderate price movement.
Key Risks to Monitor
- Recent decline may continue if selling pressure remains.
- Price near resistance may limit upside movement.
- Short-term returns show weakness.
- Market volatility can affect price direction.
Technical Summary
KSB (NSE:KSB) is trading near ₹906.35, down around 7.38%, and remains above its 51-day SMA near ₹826.59, while the 14-day RSI near 49.39 points. Immediate support is placed in the ₹800.00–₹830.00 zone near the moving average, while resistance is seen back toward the ₹975.00–₹1,025.00 range.
Summary
KSB (NSE:KSB) stock fell over 7% to ₹906.35 but remains above its 51-day SMA, indicating nearby support. RSI shows neutral momentum, suggesting no clear trend. Short-term performance is weak, but long-term returns remain positive. Support is placed between ₹800 and ₹830, while resistance is seen in the ₹975 to ₹1,025 range.
FAQs
- Why did KSB stock fall today?
The stock declined due to selling pressure after recent gains, leading to a short-term correction in price. - What does RSI near 49 indicate?
RSI near 49 shows neutral momentum and suggests the stock is neither overbought nor oversold currently. - What levels should investors watch now?
Support is between ₹800 and ₹830, while resistance is expected in the ₹975 to ₹1,025 range.