

Highlights
- HLE Glascoat Limited (NSE: HLEGLAS) declined 20.00% to ₹379.60 during the August 11 session.
- The stock opened, touched the high and low at ₹379.60, indicating a lower-circuit move.
- June quarter consolidated total income stood at ₹30,245.04 lakh, with net profit of ₹205.38 lakh.
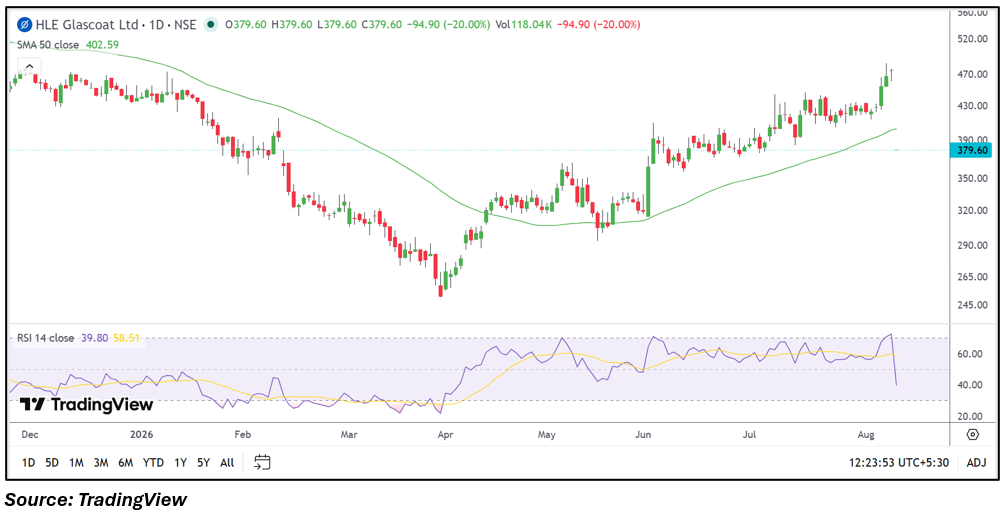
- The stock fell below its 50-day SMA of ₹402.59 during the session.
- RSI 14 dropped sharply to 39.80 after remaining at elevated levels in the preceding sessions.
- Investors should monitor the ₹379.60 level, upcoming earnings, volumes and the stock's position relative to the 50-day SMA.
Overview
HLE Glascoat Limited (NSE: HLEGLAS) operates in the field of process equipment and industrial solutions, with products serving industries including chemicals, pharmaceuticals and related processing applications. The stock declined 20.00% to ₹379.60 on August 11, 2026, from the previous close of ₹474.50. It opened at ₹379.60 and remained at the same level for the reported high and low, indicating that the stock was at its lower circuit during the session. VWAP was also ₹379.60, while trading volume stood at approximately 118.04 thousand shares. The sharp decline followed the company's latest June quarter financial update and came after a strong recovery in the share price during the preceding months. The market reaction has therefore brought both the latest financial performance and elevated valuation indicators back into focus.
Fundamental View
For the quarter ended June 30, 2026, HLE Glascoat reported consolidated total income of ₹30,245.04 lakh, profit before tax of ₹436.79 lakh and net profit of ₹205.38 lakh. Earnings per share stood at ₹0.40. The latest numbers provide an important reference point for assessing profitability, particularly as the stock had experienced a substantial recovery before the latest decline. The company operates in capital-intensive industrial segments where order flows, capacity utilisation, raw-material costs, margins and demand from chemical and pharmaceutical customers can influence financial performance. Future quarterly results will be important for monitoring revenue growth, profitability, cash generation and whether earnings expansion can support the company's valuation.
Technical View
The daily chart shows a sharp reversal after the stock had advanced from its April lows and moved substantially above its 50-day SMA. Before the latest decline, the stock had reached the ₹470-plus zone, but the August 11 session pushed it to ₹379.60, below the 50-day SMA of ₹402.59. RSI 14 has fallen to 39.80 from elevated levels seen in recent sessions, indicating a significant deterioration in short-term momentum. The price action also shows a complete session move at ₹379.60, consistent with the reported 20.00% decline. The immediate technical structure has consequently weakened, and subsequent sessions will be important for assessing whether the stock stabilises around the current level or continues to develop a lower price structure.
Key Technical Levels
Immediate support is around ₹379.60, corresponding to the current session level. The next support zone is near ₹350.00, based on the broader price structure visible on the chart. Immediate resistance is around ₹402.59, corresponding to the 50-day SMA. The next resistance zone is around ₹430.00, where the stock had previously spent time consolidating before its recent advance. These levels provide reference points for tracking the stock after the sharp decline.
Risks to Watch
- The stock's 20.00% one-day decline represents a significant increase in short-term volatility.
- The price has moved below its 50-day SMA of ₹402.59.
- June quarter net profit was ₹205.38 lakh on consolidated total income of ₹30,245.04 lakh.
- The company's valuation remains an important consideration following its earlier price recovery.
- Chemical and pharmaceutical capital spending cycles can affect future order flows and earnings.
Summary
HLE Glascoat (NSE: HLEGLAS) declined 20.00% to ₹379.60 after its latest June quarter financial update, with the stock remaining at the reported lower-circuit level throughout the session. The company recorded consolidated total income of ₹30,245.04 lakh, profit before tax of ₹436.79 lakh and net profit of ₹205.38 lakh, with EPS at ₹0.40. Technically, the stock has fallen below its 50-day SMA of ₹402.59, while RSI has dropped to 39.80. Future monitoring will focus on price stability around ₹379.60, the ₹402.59 moving average, upcoming financial results, operating margins and demand conditions across its end-user industries.
FAQs
Q: What triggered the fall in HLE Glascoat shares?
A: The stock declined 20.00% on August 11, 2026, following the latest June quarter financial update and a sharp reversal after its earlier price recovery.
Q: What were HLE Glascoat's latest quarterly results?
A: Consolidated total income was ₹30,245.04 lakh, profit before tax was ₹436.79 lakh and net profit was ₹205.38 lakh for the June quarter.
Q: What is HLE Glascoat's 50-day SMA?
A: The 50-day SMA is ₹402.59, which is above the latest market price of ₹379.60.
Q: What is the latest RSI reading for HLE Glascoat?
A: RSI 14 is 39.80, showing a sharp decline in short-term momentum compared with the preceding sessions.
Q: What technical levels should be monitored for HLE Glascoat?
A: ₹379.60 is the immediate support reference, while ₹402.59 represents the 50-day SMA and the first major resistance reference.