
Highlights
- Nureca shares declined sharply after the company reported a quarterly net loss.
- March quarter results showed negative profitability despite revenue generation.
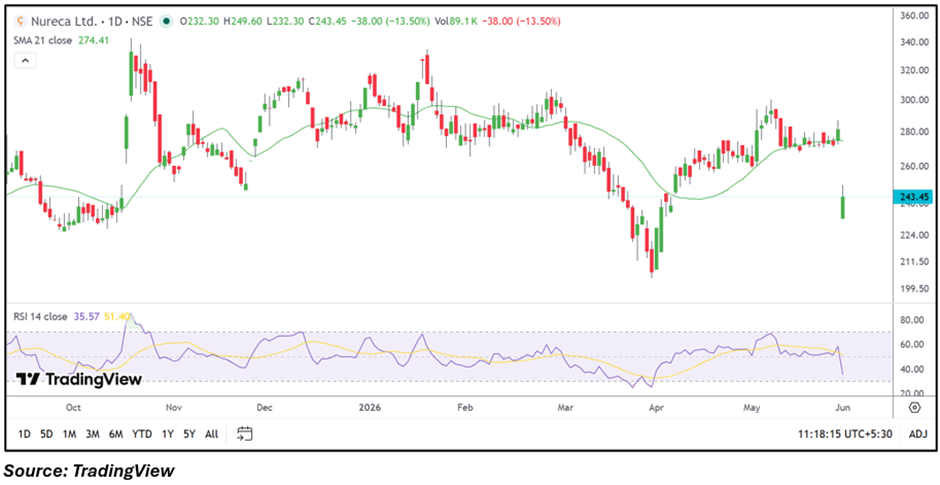
- Technical indicators weakened as the stock slipped below its 21-day SMA.
Overview
Nureca (NSE: NURECA) came under significant selling pressure on June 1, with the stock falling nearly 13% to around INR 245.45. The decline followed the company's March 2026 quarter earnings announcement, which reflected losses at both the pre-tax and net profit levels. The earnings outcome appears to have weighed on investor sentiment, leading to a sharp correction in the share price.
Fundamental View
For the quarter ended March 2026, Nureca reported total income of INR 3,646.70 lakh. However, the company posted a loss before tax of INR 615.20 lakh and a net loss of INR 662.50 lakh. Earnings per share stood at negative INR 6.95.
The latest results indicate that profitability remained under pressure during the quarter. While the company continued to generate revenue, the reported losses likely influenced market participants to reassess near-term earnings expectations.
Technical View
Nureca is currently trading below its 21-day SMA of INR 274.41, reflecting a weak near-term technical structure. The stock witnessed a sharp breakdown from its recent trading range and erased gains accumulated during the previous recovery phase.
Price action suggests renewed bearish momentum, with sellers dominating the session. The stock has also moved away from its recent consolidation zone, indicating increased volatility in the near term.
Momentum Indicator
The 14-day RSI is near 35.57, moving closer to oversold territory. Momentum has weakened considerably following the latest decline, although the indicator has not yet shown a definitive reversal signal. Traders may watch for stabilization in RSI readings before assessing the possibility of a recovery attempt.
Key Technical Levels
Based on the CMP of INR 245.45, immediate support is placed near INR 233.18 and INR 220.91. On the upside, resistance levels are positioned around INR 257.72 and INR 269.99. The stock may require sustained movement above these resistance zones to improve the current technical outlook.
Risks to Watch
- Continued losses could affect earnings visibility.
- Margin pressure may weigh on future profitability.
- Weak technical structure could increase volatility.
- Consumer demand fluctuations may impact revenue growth.
Summary
Nureca shares witnessed a sharp decline after the company reported losses for the March 2026 quarter. Although revenue generation continued, negative profitability metrics appear to have weighed on sentiment. Technically, the stock has slipped below its 21-day SMA while momentum indicators remain weak. Investors are likely to monitor whether the stock stabilizes near support levels or faces additional pressure in the coming sessions.
FAQs
Why did Nureca shares fall after the results?
The company reported a net loss of INR 662.50 lakh and negative EPS, which may have impacted investor sentiment.
What was Nureca's EPS in the March 2026 quarter?
The company reported an earnings per share loss of INR 6.95 for the quarter.
What are the important levels to watch?
Support levels are near INR 233.18 and INR 220.91, while resistance is around INR 257.72 and INR 269.99.