
Highlights
- ORTIN GLOBAL shares declined over 8% after a recent sharp rally.
- The stock remains above its 50-day SMA despite the latest correction.
- Profit booking emerged after the stock touched a fresh swing high.
Overview
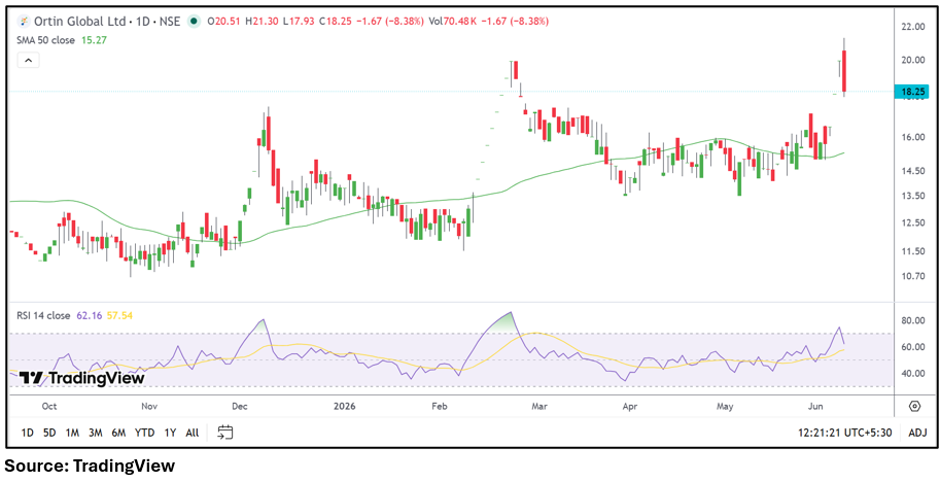
ORTIN GLOBAL (NSE: ORTINGLOBE) came under selling pressure on June 9, with the stock falling 8.38% to ₹18.25. The decline followed a sharp rally that had pushed the share price near recent highs above ₹21. The stock witnessed increased volatility during the session as traders appeared to lock in gains after the recent upmove.
The company remains a relatively small-cap counter and is currently classified under GSM surveillance measures. Additionally, the company has reported losses for multiple quarters, which may contribute to heightened price swings and investor caution.
Fundamental View
ORTIN GLOBAL reported standalone total income of ₹30.78 lakh for the quarter ended March 2026. The company posted a loss before tax of ₹0.89 lakh and a net loss of ₹0.93 lakh during the quarter. Earnings per share stood at negative ₹0.01.
The latest financial performance indicates that profitability remains a challenge. While market participants have recently shown interest in the stock, investors may continue to monitor earnings recovery, revenue growth, and operational improvements for signs of sustained business progress.
Technical View
ORTIN GLOBAL is currently trading at ₹18.25, down 8.38% for the session. Despite the sharp correction, the stock continues to trade above its 50-day SMA of ₹15.27, suggesting that the broader short-term structure remains constructive. The recent rally pushed the stock to fresh swing highs before sellers emerged near the upper end of the range. RSI stands around 62, easing from higher levels and indicating that momentum has cooled following the recent advance. The current pullback appears consistent with profit booking after a sharp rise, though traders may watch whether the stock can stabilize above its key moving average.
Key Technical Levels
Based on the current market price of ₹18.25, immediate support is placed near ₹17.34, followed by a stronger support zone around ₹16.43. On the upside, resistance is seen near ₹19.16, while a breakout above that level could bring the next resistance zone around ₹20.08 into focus.
Key Risks to Watch
- Continued quarterly losses may weigh on sentiment.
- GSM surveillance status could impact trading activity.
- Sharp price volatility may persist.
- Low business scale compared with larger peers.
Summary
ORTIN GLOBAL witnessed a notable correction after a strong rally that carried the stock to fresh highs. While the latest decline reflects profit booking and increased volatility, the stock remains above its 50-day SMA, indicating that the broader technical structure has not yet broken down. Investors may closely monitor price behaviour around support levels and future financial performance for further direction.
FAQs
- Why did ORTIN GLOBAL shares fall today?
The stock declined as traders appeared to book profits following a sharp rally that pushed prices to recent highs.
- Is ORTIN GLOBAL still above its 50-day moving average?
Yes, the stock continues to trade above its 50-day SMA, indicating that the broader short-term trend remains intact.
- What should investors watch next?
Investors may monitor support levels, earnings performance, and whether the stock can maintain momentum above key moving averages.